Improve Portfolio Health By Avoiding Two Portfolio Management Extremes

Two Simple Questions

You can measure your general portfolio health with two simple questions:

1) Do you approve all or almost all of your projects?

2) Are you approving so few projects that people would say you are “cutting to the bone”?

These are two portfolio management extremes that we will examine in this post.

Approving Everything is Bad

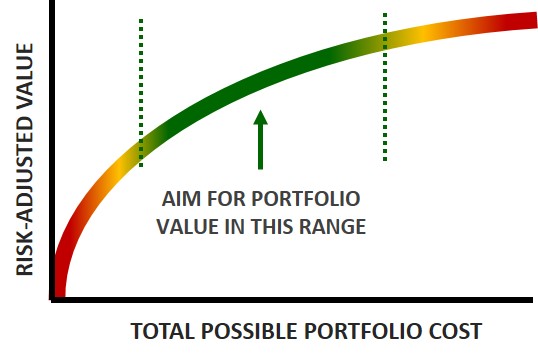
Question number one highlights a common trap for many companies, approving all or almost all projects that get reviewed.  This indicates that the project selection process is not working well. When governance councils have a project approval over 90%, it means very few projects are getting screened out and some poor projects are probably getting approved. Approving nearly all projects also means that significant diminishing returns kick in for this group of projects and executing this work likely requires unnecessary multi-tasking and exceeding the resource capacity of critical resources. While it is theoretically possible for an organization to do an outstanding job of selecting the best possible project candidates upfront and still have a high approval rate, I doubt this occurs very often. More likely, organizations operate in a reactive mode and approve projects as they get proposed; since most projects look good by themselves and almost always have a good reason for getting initiated, the project gets approved and funded. Therefore, one of the best portfolio governance council metrics to measure portfolio health is the project approval rate. We can illustrate these concepts with the graphic below.

Portfolio Cumulative Frontier - Extreme 1
Portfolio Cumulative Frontier – Extreme 1

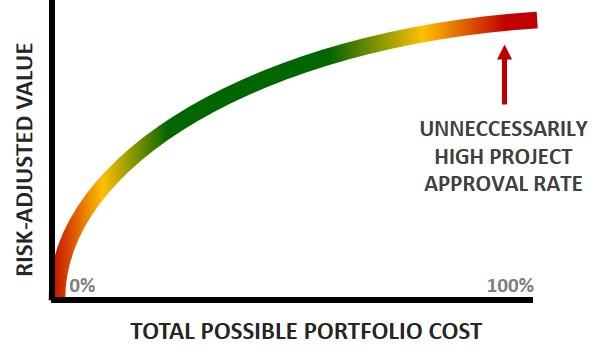
Here we have a bounded curve of possible portfolios (in this case we can apply the cumulative frontier, which is the cumulative portfolio value based on the rank order of projects in the portfolio, not to be confused with the efficient frontier which is based on portfolio optimization). At the upper far right is the problem area in question. If organizations are approving most projects it means there is little to no discrimination among projects which is a symptom of not having enough project candidates to review and stems from poor ideation, work intake, and weak phase-gate processes.. When organizations have more project candidates than they can reasonably take on, the governance council is pushed to do a better job of selecting projects. Organizations can still do a poor job of selecting projects (or may simply ignore resource capacity and continue approving everything) even when they have more than they can take on, but the emphasis here is on increasing the project pipeline so that the governance council will become less reactive and more proactive and say no to projects that really should be screened out. Creating a strategic roadmap to identify important projects (top-down approach) combined with an employee ideation (process bottom-up approach) will help build up the pipeline of projects and increase the decision making rigor by the governance council.

Don’t Cut to the Bone

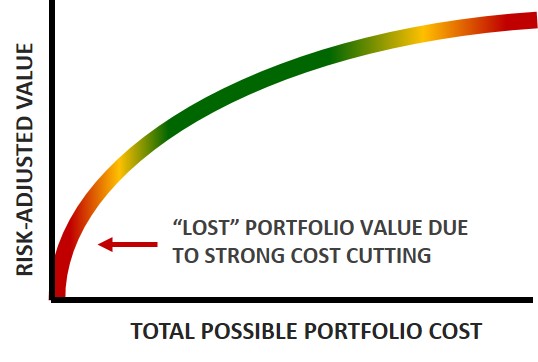
We can also evaluate portfolio health by looking at the other extreme where an organization is cutting costs so much that any further cuts will hurt the organization’s day to day operations (aka “cut to the bone”). In one place I worked, the cost-cutting measures had been in place for years and a number of good project candidates were hardly under consideration because funds simply were not available and a buildup of project requests was accumulating. A few high value projects got approved, but “money” was left on the table as a result of not taking action on those good project candidates. In some cases, the rigor to do a good cost-benefit analysis is absent and makes it difficult to communicate how much ‘value’ is being ignored by not taking on additional projects due to strong cost cutting measures. Such extreme cost cutting also has the negative residual effect of discouraging innovation among employees. We can also illustrate this with the same graphic.

Portfolio Cumulative Frontier - Extreme 2
Portfolio Cumulative Frontier – Extreme 2

Summary

In short, asking simple questions about the approval rate of projects and the cost-cutting measures of an organization can highlight general portfolio health. In both cases, organizations should be pushing toward the middle. Adding more project candidates will help ensure that only the most valuable projects get approved. In the case of extreme cost-cutting, companies should improve their ability to measure project value in order to communicate the ‘value’ left on the table. This is best accomplished when a company is doing reasonably well and not when the company is truly in dire straits. Cutting costs “to the bone” is never a good way to stimulate innovation, therefore careful attention is needed when companies are cutting costs too much and not investing in the future.

Cumulative Frontier - Healthy Portfolio

Portfolio Reports – Portfolio Bubble Charts

This is the third post in a series on portfolio management reports. In the first post, we reviewed introductory portfolio management reports that convey the basic dimensions of the portfolio. In the second post we reviewed treemaps and advanced pareto charts that can help identify outlier projects worthy of more scrutiny. In this post we will look at the most common report for project portfolio management, portfolio bubble charts.

SUMMARY

The risk-value portfolio bubble chart represents a portfolio view of all projects and puts projects into one of four quadrants based on value and risk; this is important for identifying projects that drive overall greater value to the organization compared to other projects as well as highlight projects that should likely be screened out.

BENEFITS OF PORTFOLIO BUBBLE CHARTS

One of the key benefits to a portfolio bubble chart is to quickly show the balance of the current portfolio.  Using portfolio bubble charts with the portfolio governance team can focus conversations to help better manage the portfolio. When reviewing projects that are in the higher-value/ lower-risk quadrant, the portfolio governance team should ask the question, “how can we get more of these types of projects in the portfolio?” Likewise with the lower-value/higher-risk projects, the portfolio governance team should ask how to avoid those types of projects. These discussions will greatly enhance the management of the portfolio and enable the portfolio governance team to “manage the tail” and ensure that only the best projects are selected and executed.

DATA NEEDED

There are four primary data elements needed to build the risk-value bubble chart: value scores for each project, risk scores for each project, categorical data, and the project cost or financial benefits of the project (commonly used for bubble size). In an older post, I wrote in detail on how to build such a chart in Excel and the notion of normalizing the data. A prioritization scoring mechanism is typically required to build the best portfolio bubble charts.

Portfolio Bubble Chart Example

Portfolio Reports – Part 2

In the previous post, we reviewed very basic portfolio reports that can easily generated with initial data. In this post we will continue examining portfolio reports with an emphasis on intermediate level reporting.

Pareto Chart (Financial Contribution)

All companies should have a breakdown of project cost, but not all companies capture project value. For those that do, a Pareto chart ordered by financial contribution (e.g. NPV) provides aggregate portfolio visibility of the most valuable projects. We also find that the 80/20 rule often applies (20% of the projects deliver 80% of the portfolio’s value). This type of Pareto chart provides great visibility of the entire portfolio and highlights how a subset of projects support overall financial contribution.   It is a great report for focused discussions regarding how to manage the long tail of low value projects. It is critically important for the portfolio governance team to recognize this tail of projects and how to deal with it. The minimum required data to generate this report is a financial metric (cost, dollar savings, NPV, etc.) and the Project Name or ID.

Advanced Pareto Chart

We can take this Pareto chart a step further and overlay additional data points to make it an even more powerful report. In the example below, we have overlaid the cumulative R&D labor (as a percentage of R&D labor across all projects). By adding in this additional resource data, we can clearly see that we can still achieve 80% of the total portfolio value with only 65% of the anticipated R&D spend. In the absence of portfolio optimization, this insight can be valuable when managing bottleneck resources as it points to additional projects that can be accomplished without the use of critical resources. You can substitute R&D for any other role in your company that is a bottleneck to many projects.

These enhanced portfolio reports provide great visibility of the entire portfolio and how a subset of projects support overall financial contribution.   It is an even better tool for focused discussions regarding how to manage “the tail”. All you need is the following data: Financial metric (cost, dollar savings, NPV, etc.), project name/ID, Resource data or other categorical measurement.

Advanced Portfolio Pareto Chart

Treemaps

Treemaps offer a graphical alternative to traditional risk-value bubble charts and provides a quick glance of the entire portfolio with categorical information included (e.g. box size = cost, color = project value, grouping by category). The basic information may be similar to traditional bubble charts, but the coloring and sizing can raise awareness of different problems or challenges in the portfolio and is a great report for identifying misaligned projects. I recommend using treemaps in addition to bubble charts (which we will discuss in the next post).  Treemaps are common in data visualization software such as Tableau and requires data such as: financial measure (cost, revenue, savings), risk measures (optional), project value (e.g. a value score). Instead of coloring based on value score, you could color based on alignment to particular strategic objectives or by business unit. The example below shows a basic cost/value treemap.

Portfolio Treemap Example

Summary

In this post, we have seen two great intermediate portfolio reports that will enhance governance discussions. These reports help move senior leaders away from a singular project view to an aggregate project view. Even though we adjust individual portfolio components (aka projects), our view is to identify an optimal portfolio.

Are you using advanced Pareto charts and treemaps in your portfolio meetings? Share a comment below.


Portfolio Reporting Part 1

In a previous post, I wrote that from a very pragmatic point of view, getting the right data to leadership at the right time is at the heart of good project portfolio management. If the right data is not available for decision makers to use, the issue will be mediocre results at best. In actuality, the right data needs to be used to create the right reports to support strategic decision making. Hence, strong portfolio reporting must be a core capability for any organization utilizing portfolio processes. If you are not creating the right reports, then how well is your portfolio process actually working?

In the next few blog posts we will look at various types of portfolio reports, starting with basic reporting and concluding with advanced reporting.

In this first example, we will look at basic bar charts, which can represent subsets of projects in multiple dimensions:

  1. By Strategic Goal
  2. By Project Type
  3. By Sponsoring Business Group
  4. By Sponsor

The intention is to provide a quick visual overview of a certain category of projects (e.g. that align to a strategic goal or which belong to a certain sponsor). These charts provide a quick glance of projects sliced in different ways. There may not be much insight, but simple charts like this could highlight possible gaps in the portfolio and are useful for focused discussions around certain types of projects.

Basic Portfolio Report 1

The next set of basic portfolio reports focus on portfolio metrics. Pie charts of portfolio data are very easy to pull together and can be viewed categorically in different ways:

  • Projects By Category (Count, %)
  • Projects by Category (Cost)
  • Projects by Category (Value generated)

Some categorical examples include: health status, project type, strategic goal, sponsor, organization

Pie charts are really just a snapshot in time, but when data is collected over time, we can also graphically depict trends, which can uncover portfolio gaps. Such gaps highlight areas that need more governance attention and help facilitate focused discussions around managing the portfolio.

Organizations need to collect the following data in order to create these reports: categorical data, financial metric (cost, value, etc.), resource hours, etc.

Basic Portfolio Report 2

In the next post we will look at more intermediate portfolio reports.  In the meantime, what are your favorite portfolio reports? What has worked well for your organization?

Strengthen Talent Management With PPM

Talent Management3Is It Just About Talent Acquisition?

When people refer to the “war for talent” many discussions center on talent acquisition and try to answer the question “how do we hire the best people?” Although talent acquisition is important, talent development and retention are also very important (you want to keep those great people you hired, correct?). Hiring good people is not the most challenging part; because the war for talent is real, retaining talented people is difficult. This is where project portfolio management (or “PPM” for short) strengthens the traditional HR approach to talent management.

In a recent LinkedIn discussion, Emily Smith asked a broad question on how PPM software can impact unemployment rates. My response was that portfolio management as a discipline and PPM software with the right data can significantly improve talent retention and development.  Before we continue down this path, let me quickly summarize project portfolio management. PPM is firstly about doing the right work to accomplish strategic goals, and it is also about focusing resource attention on high priority projects while balancing overall resource capacity. In larger organizations you can imagine how difficult it is just to monitor all of the project work going on and ensure that each project is on track to completion. However, with a little extra focus (and the right software), organizations should also monitor the skills and abilities of the people doing the work and assign people to projects that align with their interests and help them grow professionally. These last points are often after thoughts in project management because of the sheer focus on simply getting work done.

The Value of PPM to Talent Management

Consider for a moment the value to performance management of having an employee report show all of the projects they have been involved with over the last several years with the strategic importance to the organization, the complements given by their project teammates, the skills they have improved and developed, the degree of alignment to professional areas of growth, and even the people mentored during those projects. That would be powerful, and if used correctly, would send a strong message to employees that this company enables them to grow professionally and make a difference through their work. Wow.

Sadly, I don’t know if this system exists. Current HR management systems are not designed as portfolio management systems that would track this level of project detail.  Even having a system that a project manager could use to do a search across the company for people who have particular skills and experience for a new challenging project would be a great enhancement over what we have today—assigning spare bodies just to keep up with the flood of work going on.

Project portfolio management complements and enhances talent management. Do you agree? Tell me how well your talent management processes are going, especially if there is any linkage to project and portfolio management.


Talent management graphic courtesy of Lean Home Care

Increase the Value of PPM Systems

Today’s Environment

Project portfolio management (PPM) helps organizations make decisions that move the needle toward achieving their strategic objectives. In order to make those decisions, senior leadership needs the right information at the right time. This is where PPM systems come in, providing the quality data helping to inform sound decision making. Unfortunately, many companies assume that merely implementing a PPM system will improve their ability to execute strategy. There’s more to it.

Point B’s Perspective

In order for PPM systems to add value, organizations need to consider five important factors: business drivers, reporting, data, processes and people.

How to increase value from PPM Systems

Read the entire article here


Gate Review Filters

Phase-gate reviews improve project selection. If an organization wants a winning portfolio then the governance team must select winning projects. Therefore the project governance board must be able to discriminate between good projects and great projects. The phase-gate process enables the project governance board to review these projects based on preselected strategic criteria at the gate reviews of the decision gate process. At each of those gates, important project information is provided to the project governance board to make a go/no-go decision related to the project. Without this mechanism, unnecessary or poorly planned projects can enter the portfolio and bog down the work load of the organization, hampering the benefits realized from truly important and strategic projects.

The ability to screen out misaligned projects is based on the types of decision making criteria used for gate reviews. Another way to look at the criteria is that they act as gate review filters.  For instance, some companies may have no filters and approve every project; another company may only judge projects based on financial contribution and screen out very fewer projects; whereas other companies will makes gate decisions based on financial contribution, investment risk, and resource availability. We can see this by the image below.

Gate Review Filters

Types of Gate Review Filters

There are many types of decision making filters available for companies to use, the key is to apply the filters that match the organization’s current maturity and culture. Let’s take a look at a few gate review filters (not an exhaustive list):

1)      Financial filter: this gate criteria requires some sort of financial analysis to determine the profitability (or value) of the project. Applying financial hurdle rates may be one way of screening out lower value projects. Using financial benefit (e.g. net present value) is one approach to rank ordering projects.

2)      Strategic filter: most companies implementing PPM recognize the need to evaluate projects in light of strategic goals and objectives. However, if the criteria is not detailed enough, most projects can be shown to align to strategy to a certain extent.

3)      Risk filters: risk criteria at gate reviews should really be thought of as investment risk. Detailed project risks may or may not be known, but based on the type of project being proposed and the initial analysis the riskiness (or risk nature) can be understood. Depending on the risk tolerance of the organization, more projects may be screened out based on the riskiness of the project.

4)      Resource filters: a more advanced criteria is resource availability or the utilization of key resources who are currently unavailable. Since many organizations do an inadequate job of measuring resource utilization, this filter may not be used as often.

5)      Portfolio filter: for simplicity, a portfolio filter takes an aggregate portfolio view when reviewing individual projects. It measures what the impact to the portfolio is rather than only evaluating the individual merits of the project. It also relates to the balance of the portfolio (short-term versus long-term, risky versus safe, good distribution among business units, etc.).

As organizations mature their project selection process, more gate review filters (criteria) should be used to ensure that right projects get included in the portfolio. More criteria often means fewer projects get approved which means that the project pipeline more closely resembles a “funnel” rather than a “tunnel” (see this post for details).

Book Review-A Fish In Your Ear

After reading the first three chapters of A Fish In Your Ear, I stopped reading it for about a year. A lot of time is spent discussing the psychology of decision making, which is not often covered in the PPM literature, but it wasn’t enough to keep my attention. I came back to the book a year later and am glad I did because the best part of the book is in chapters 4-7.

Chapter 4 describes the importance of managing portfolio data, data integrity, and how to collect the right data. He opens up the chapter with a great quote by Bill Gates, “How you gather, manage, and use information will determine if you win or lose.”  Early on Menard mentions that an organization’s central nervous system is its information management system and that an organization is only as effective as its knowledge is good.  After a solid discussion on variables, data integrity, data-quality influencers, and other items he concludes the chapter on data collection. The list of questions in this section is one of the gems of the book. Menard does a great job of highlighting how asking the right questions can uncover the data needs of the organization.

A Fish In Your Ear

Chapter 5 builds on chapter 4 and discusses decision criteria. Having the right information is important, but it is even more important that senior leaders have defined and agreed-upon criteria to discriminate between projects. In the middle of the chapter he gives a great explanation for why having clear objectives is a necessity for making the right decisions. “Once we clarify our objective and can clearly state and compare it to alternatives, it becomes a guiding star helping us navigate to our chosen destination.”

Chapter 6 continues with a good discussion of data visualization. I fully agree that in order to make sense of so much data, it has to be visualized. Not only GenSight, but companies like Tableau are working hard to help users visualize data. The results can be very enlightening. In this chapter, Menard discusses the various elements to help visualize data: color, shapes, size, and matrices. He concludes with visual rules: give people what they want, show what matters, make it rich, make it valid, and have a purpose.

Chapter 7 focuses on portfolio selection. He brings up two burning questions early in the chapter: “will this portfolio deliver our strategic goals?” and “do we have enough appropriate resources to execute the portfolio?” The first question touches the matter of what the organization should do, the second on what they can do. The second half of the chapter provides a great discussion on the matter of portfolio optimization.

In short, chapters 4-7 of A Fish In Your Ear are worth the price of the book and provide some of the best explanations of collecting and utilizing portfolio data that I have read. Rating: 4 out of 5 stars.

Portfolio Management V-Model Part 2

In part 1 of the portfolio management V-model we looked at the left side of V (process and data) that drives better decision making. In part 2 we will look at the right side of the V (leadership and governance) and then tie everything together. Let’s start with governance.

PPM V-Model

Establishing portfolio management governance is a critical component for successful execution of PPM. Peter Weill and Jeanne Ross, authors of IT Governance, define governance as “specifying the decision rights and accountability framework to encourage desirable behavior in using IT. Governance determines who makes the decisions. Management is the process of making and implementing the decisions.” They make the point that IT governance is the most important factor in generating business value from IT and that good governance design allows enterprises to deliver superior results on their IT investments.

Governance is the foundation for all of the other portfolio mechanics, and without it, PPM doesn’t work. All benefits of project portfolio management hinge on the execution of portfolio governance. According to Howard A. Rubin, former executive vice president at Meta Group, “a good governance structure is central to making [PPM] work.” Furthermore, “Portfolio management without governance is an empty concept”. These quotes highlight the need for a well-defined and properly structured governance in order to manage the project portfolio.

Leadership is a critical component that brings the governance framework and the visionand goals of the organization together. Good leaders will develop the right goals and strategies for the organization. At the same time, good leaders will also develop the necessary governance infrastructure to make good decisions that will drive the execution of the strategy they have put in place. Moreover, good leaders will hold management accountable for following the governance process and will take ownership for achieving the organizational goals. In sum, leadership drives accountability.

Good governance processes enable better decision making but do not ensure it. The real decision makers on the portfolio governance board should be strong strategic leaders who make the right decisions at the right time. Portfolio management requires prioritization and trade-off decisions, which can be difficult tasks amidst strong politics and/or dynamic environments. True leaders will not compromise and accept mediocre results, even when that is the easiest path to take. Good strategic leaders will make difficult decisions (aka “the right decisions”) in the face of difficult circumstances. This is why leadership is needed in addition to governance for making better strategic decisions.

We can connect all of the components together now and see how they fit together. Good decision making requires having the right data at the right time, and it also requires strong leadership to utilize that data for making the best decision possible at any point in time. In order to have good data, organizational processes are required to collect the data and maintain it. Governance processes are also needed to ensure that the governance board operates efficiently and effectively. Even if there are good governance processes and place, and the roles and responsibilities are well understood, real leadership is needed to make difficult decisions that best utilize resources and accomplish company goals (even when not popular among all stakeholders). These decisions relate to the projects and programs in the portfolio that will execute strategy and meet company objectives. The simple portfolio management V-model helps tie together four critical components of PPM that lead to better decision making and result in greater strategic execution.

Portfolio Management V-Model Part 1

I recently constructed a portfolio management-oriented V-model. The traditional V-model has been used in software and product development, but this PPM variant differs in that the end result comes together at the point of the V. This is not an exhaustive list of PPM components, but does represent critical components and how they come together to drive better decision making resulting in optimal strategic execution. The model also makes a big assumption that the organization has sufficient strategy development capabilities in place.

Let’s work backwards (from the point back to the tips of the V) to understand how components on the left side supports the model.

 PPM V-Model

One of the primary goals (if not the foremost goal) of portfolio management is to execute strategy. There is an important distinction between strategy creation and strategic execution. Possessing a strategy (and spending the energy to create one) is meaningless if the organization cannot accomplish the strategic goals. Although many people acknowledge that strategic projects are vehicles for a accomplishing a strategy, senior leadership needs to make the right project decisions at the right time to advance the goals of the company. Hence, making smarter and better decisions is a precursor for solid strategic execution.

In order to make smarter and better decisions, the right data needs to be available at the right time. I have written about this in the past. Senior leaders should know what data is important and valuable for making the right decisions at the right time. Data collection costs money as does data analysis. Organizations should be mindful of the amount of effort needed to collect data and only collect data that is most important to the company. In another post, I wrote about a virtuous data cycle by which senior leaders need to actually use the data collected, communicate that the data is being used, and explain how the data is being used. This will encourage higher quality data collection resulting in better decision making. However, in order for the right data to be collected at the right time, processes need to be in place to facilitate the data collection process. Processes for work in-take, business case development, status updates, and resource management help provide the right data in the portfolio management lifecycle to promote better decision making.

The next post will explore the right side of the model and tie all the points together.

Greater Value From Portfolio Management Systems

Portfolio management systems have a very real place in making PPM processes successful. These systems have the potential to drive value in a number of ways, some of which are highlighted below:

1) Enterprise repository (“single source of truth”)—having a single system that contains up-to-date and accurate project and portfolio data is valuable. Gone are the days of maintaining multiple versions of static Excel files that contain the current “authorized” list of projects. This value is magnified the easier it is to access the system and the greater the number of users who access the system.

2) Process enabler—on top of merely storing project and portfolio data, portfolio management systems can better enable portfolio processes through workflow automation. This is particularly useful for stage-gate project reviews that have a number of review steps and need approval by multiple parties.  Portfolio management system can also better enable project management and capacity management processes. Thus the tool reduces the amount of work needed to carry out these processes, reducing lead time and costs.

3) Portfolio tools—portfolio management systems commonly come with tools that make portfolio management easier overall. One clear example is portfolio optimization, which is difficult (if not impossible) with spreadsheets and other databases. Portfolio management systems can make this otherwise difficult job easier by providing the tools needed to effectively get the job done.

4) Reporting and analytics—one of the greatest benefits of utilizing portfolio management systems is to get accurate and up-to-date reports on the status and health of projects, programs, and portfolios. Buying a portfolio management system and not utilizing the reporting capabilities or analytics is like buying a car with only two gears—you’ll make progress but not as quickly as you will by providing decision makers with insightful information and up-to-date reports.

The critical question then is, “how much value are you getting out of your portfolio management system?” If the cost of the system plus the cost of entering data plus the cost of maintaining the system exceeds the value of the information coming out of it, senior leadership either needs to reconsider its ways or change its portfolio management system.

As we discussed in an earlier post, leadership plays a huge part in making sure the right data gets fed into the system at the right time. Yet, leadership plays just as big of a role in making sure the organization gets value from its portfolio management system. Let’s quickly review the four areas where companies can derive value from portfolio management systems and the potential risks.

1) Enterprise repository—if employees and managers do not access the system often, or if there are competing places to get similar project and portfolio data, the system loses value.

2) Process enabler—if project and portfolio processes are not regularly followed, then the effort to load the system with data to enable those processes is a waste of time.

3) Portfolio tools—if the organization does not leverage the tools available in its portfolio management system, then it paid extra money for tools it doesn’t use.

4) Reporting and analytics—if senior management does not pull reports and use the data, then all the effort to ensure that quality data is going into the system is a waste of time. Even worse, if management does not communicate that it uses the data and demonstrate how it uses the data, the organization easily becomes skeptical of the value of portfolio management.

What value do you currently get from your portfolio management systems? Have you encountered any of the problems mentioned above?

Be Sure To Use The Portfolio Data

Data represents a major facet of successfully implementing project portfolio management (PPM). In a previous post, I discussed how data drives the portfolio management engine and some of the key components for getting good data into the tool. Some important portfolio data types includes: financial data, resource data, schedule data, and benefits data. Leadership plays a pivotal part in the whole process from determining which data is needed to using the data for better decision making. This post will concentrate on the last part of the process—how to use the portfolio data.

Use the Portfolio Data

Data quality is never perfect at the beginning of a portfolio management process. Collecting data takes time and effort, and with so much demand on individual’s time, people do not want to waste time collecting data that is unnecessary or won’t be used. This is why it is so important for senior leaders to use the portfolio data. When leadership uses the data, they will understand what data is truly needed for higher quality decision making. Moreover, once the data gets used, the gaps in the data will be readily apparent and will give senior leaders an opportunity to reinforce the importance of the portfolio processes (that collect the data in the first place).  However, using the data is only the first step in a three step process. Next, leadership needs to communicate that the data is being used.

Communicate that You Use the Portfolio Data

Communicating that the portfolio data is being used is a conscious effort on the part of the senior management team, but is something very easy to do. It can also easily be overlooked. Think about it. Project managers and resource managers can put data into the PPM system not knowing if it is simply going into a black hole or is actually helping the organization. Without communication, they may never hear whether the data is actually being used. A prime example occurs with resource data and capacity management. In order for capacity management to be successful, good data is needed, which takes a lot of effort by project managers and resource managers. If the project managers and resource managers do not believe that the data is actually being used, there will be less effort going forward in entering and maintaining the data. Even when an organization is mandated to use a PPM system, the data can be compromised by a small number of people who do not take the process seriously. Communicating that the data is being used is necessary for reinforcing the importance of the portfolio processes, yet senior leadership needs to take one more step—demonstrate how the data is being used.

Demonstrate How You Use the Portfolio Data

Communicating that the data is being used is good, but demonstrating how the data is being used is even better. This will send a clear message to the organization of how important it is to maintain accurate and up-to-date information in the portfolio system. If the data is being used to drive decisions around strategic project investments, staffing plans, bonuses, etc., then people will be more likely to spend the time to enter, update, and maintain the data. However, if the data is used to create a report that merely scratches the itch of a curious executive, then the people involved with the portfolio processes won’t have much interest in making sure that the data is accurate and up-to-date.

Using portfolio data, communicating that the portfolio data is being used, and demonstrating how the data is being used are the responsibilities of senior leadership. None of these steps are difficult, but need to be taken on a regular basis if the organization wants to be successful with portfolio management. Collecting data comes at a price, and if the data isn’t being used, it is better for the organization to stop wasting its time and focus on things that move the organization forward. A small amount of effort on the part of the senior leaders can go a long way toward making portfolio management successful and useful. Data is the fuel that runs the portfolio engine. Bad data will clog the engine; good data will help the organization sail forward. Using the data, communicating that the data is being used, and demonstrating how the data is being used will not only make the difference in being successful at portfolio management, it’s also smart business.


Use the portfolio data
How to use the portfolio data

The Right Portfolio Data at the Right Time

From a very pragmatic point of view, getting the right data at the right time is at the heart of good project portfolio management. If the right data is not available for decision makers to use, the issue will be mediocre results at best. Portfolio management is about selecting the right projects, optimizing the portfolio to deliver maximum benefit, protecting portfolio value to ensure that that value is delivered, and improving portfolio value by maturing organizational processes. At every step, data is required. The quality and quantity of data correlates to portfolio maturity. Some less mature organizations will collect insufficient data which leads to sub-optimal decisions. Other organizations may try to collect too much data before they are ready to utilize it and can do more harm than good by burning out employees with burdensome processes. Mature organizations will have the discipline and rigor to collect the right amount of quality data.

Therefore, understanding the data needed upfront is a success factor for portfolio management. There are several types of portfolio data:

  • Strategic data
  • Resource data
  • Schedule data (forecasts and actuals)
  • Performance data
  • Financial data (estimates and actuals)
  • Time tracking
  • Request data
  • Etc.

Senior management bears the responsibility for identifying the right data to be used in the portfolio management process. In addition, senior leadership needs to drive the accountability for collecting the right data. Without active engagement and feedback from senior management, data quality can suffer.

Organizational processes are very important for ensuring that the right data is collected. Selecting the right projects requires that good data is collected about each candidate project. Such data must be relevant to the senior management team that makes portfolio decisions. Data that is not used for decision making or information sharing is considered a waste. Collecting data comes at a cost, and organizations need to put the right processes in place in order to collect good data. From this angle, portfolio management processes are about collecting a sufficient amount of the right data. Without good standards and processes, important portfolio data will be collected inconsistently resulting in confusion and possible error.

Portfolio tools have a very important place in the portfolio management ecosystem, but only after leadership has identified what is required and lean processes have been created to facilitate data collection. Portfolio systems store and transform project and portfolio data for general consumption (aka reporting and analytics). For less mature organizations with fewer data requirements, simple portfolio systems such as Excel and Sharepoint can be used in the portfolio process. Maturing organizations should select portfolio software that meets the needs of its data requirements.

Lastly, senior leadership needs to use the data in the system for making better portfolio decisions. Strong portfolio systems will generate the reports and analytics necessary to support better investment decisions. Good data is the fuel that makes the portfolio engine run! Without good ‘fuel’, senior management will be unable to drive the organization toward its strategic goals. The data perspective of portfolio management begins and ends with senior leadership.

Data-Perspective-of-PPM