In a previous post, I wrote that from a very pragmatic point of view, getting the right data to leadership at the right time is at the heart of good project portfolio management. If the right data is not available for decision makers to use, the issue will be mediocre results at best. In actuality, the right data needs to be used to create the right reports to support strategic decision making. Hence, strong portfolio reporting must be a core capability for any organization utilizing portfolio processes. If you are not creating the right reports, then how well is your portfolio process actually working?
In the next few blog posts we will look at various types of portfolio reports, starting with basic reporting and concluding with advanced reporting.
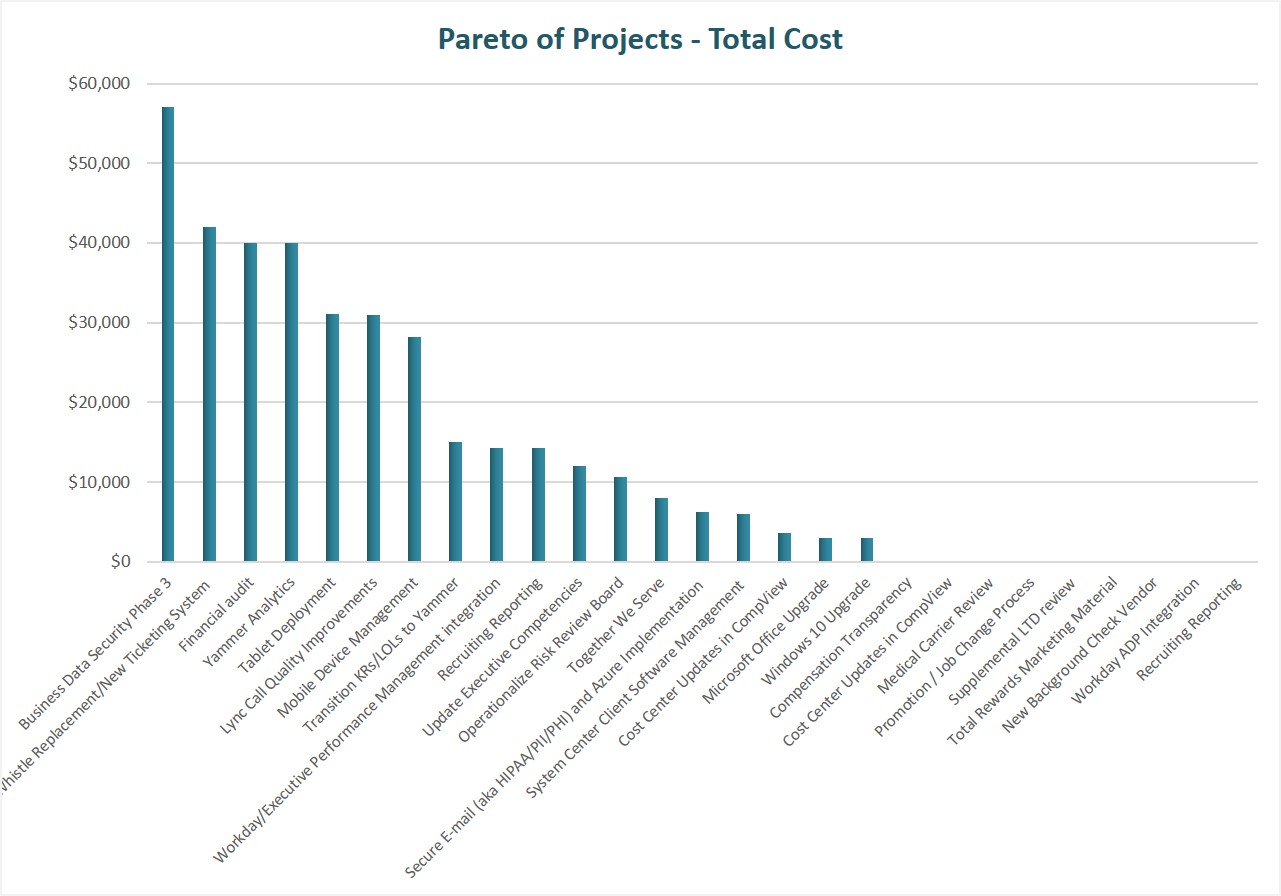
In this first example, we will look at basic bar charts, which can represent subsets of projects in multiple dimensions:
- By Strategic Goal
- By Project Type
- By Sponsoring Business Group
- By Sponsor
The intention is to provide a quick visual overview of a certain category of projects (e.g. that align to a strategic goal or which belong to a certain sponsor). These charts provide a quick glance of projects sliced in different ways. There may not be much insight, but simple charts like this could highlight possible gaps in the portfolio and are useful for focused discussions around certain types of projects.
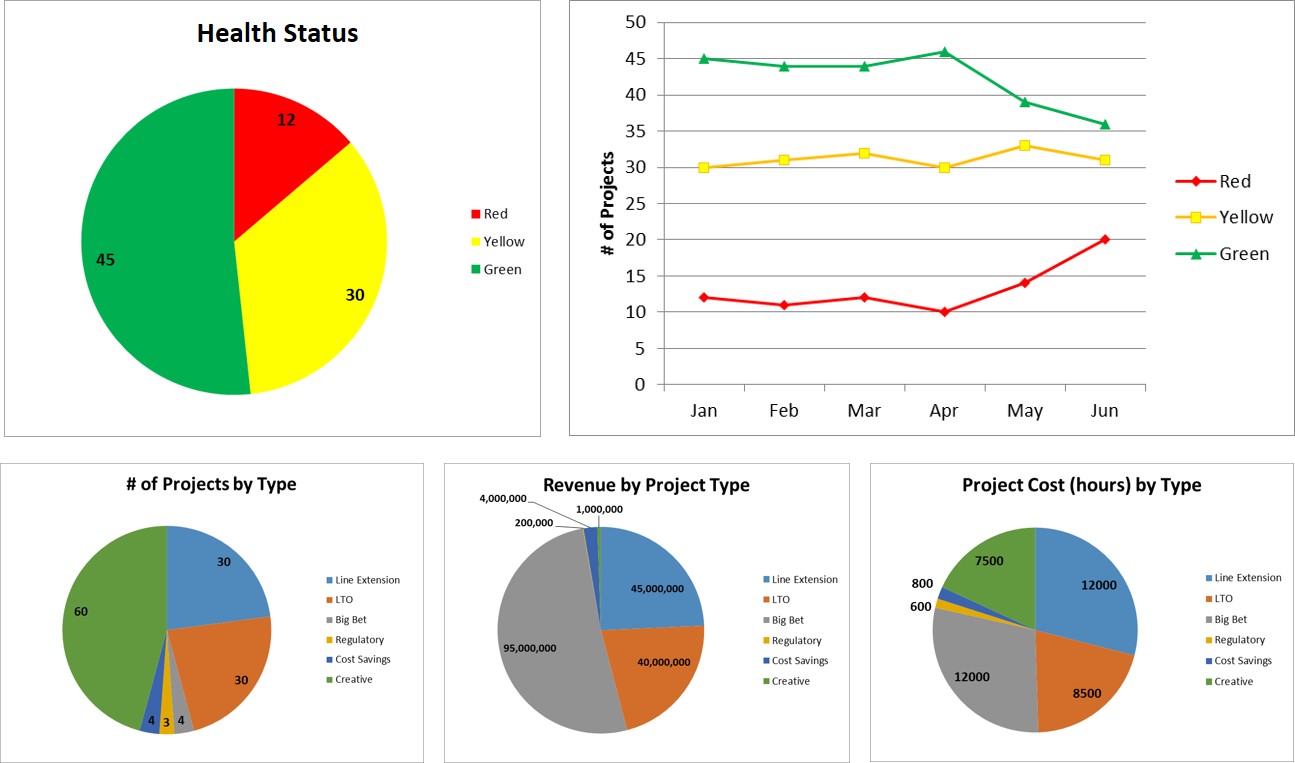
The next set of basic portfolio reports focus on portfolio metrics. Pie charts of portfolio data are very easy to pull together and can be viewed categorically in different ways:
- Projects By Category (Count, %)
- Projects by Category (Cost)
- Projects by Category (Value generated)
Some categorical examples include: health status, project type, strategic goal, sponsor, organization
Pie charts are really just a snapshot in time, but when data is collected over time, we can also graphically depict trends, which can uncover portfolio gaps. Such gaps highlight areas that need more governance attention and help facilitate focused discussions around managing the portfolio.
Organizations need to collect the following data in order to create these reports: categorical data, financial metric (cost, value, etc.), resource hours, etc.
In the next post we will look at more intermediate portfolio reports. In the meantime, what are your favorite portfolio reports? What has worked well for your organization?