Prioritization Is the Compass

Prioritize Projects With A Scoring Model

EVALUATE YOUR PROJECTS

In the previous post, we covered the detailed steps for building a prioritization scoring model. In this post we will cover the steps for how to prioritize projects with a scoring model.

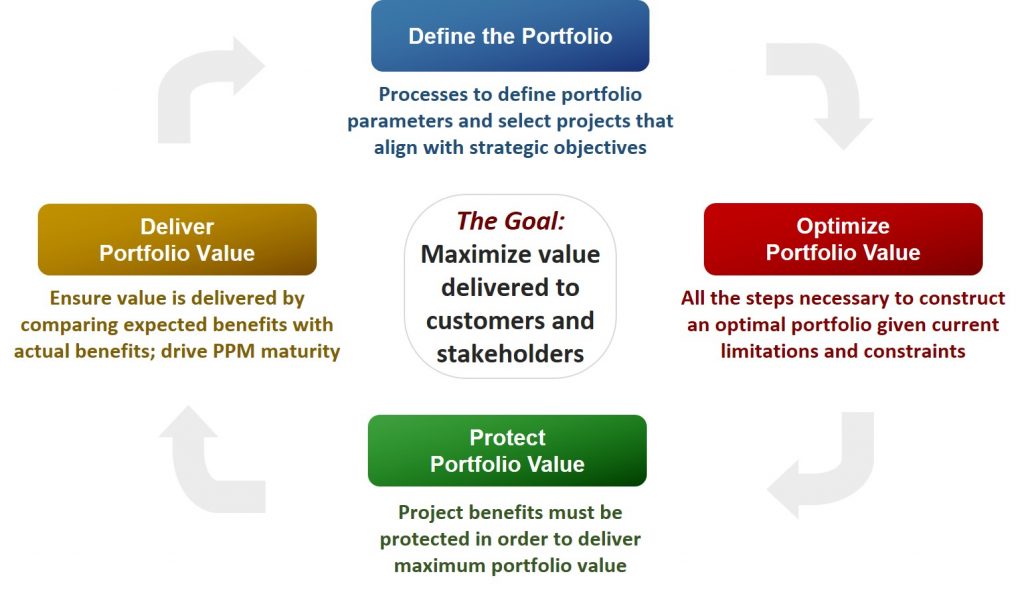
Step 4 – prioritize projects using scoring values

The last part of the scoring model is to determine the scoring values. For each criterion in the scoring model, there needs to be some evaluation of a low, medium, or high score to drive a numerical score for that criterion. In practice we can expand this to “none”, “low”, “medium”, and “high” to give the decision makers a slightly wider range of options. We do not want too many options as this can slow down the scoring process, but we want enough options to help distinguish project evaluations. A common scoring paradigm would include 0 for none, 1 for low, 2 for medium, and 4 for high. If companies want to put even more emphasis on high value, they could use a 0, 1, 3, 9 scoring paradigm.

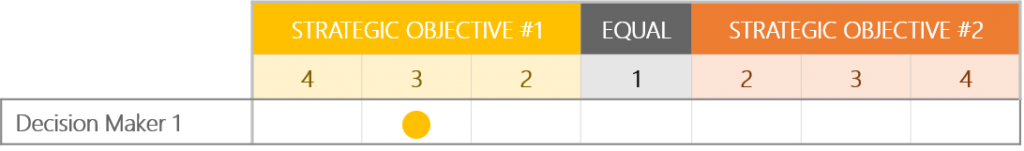
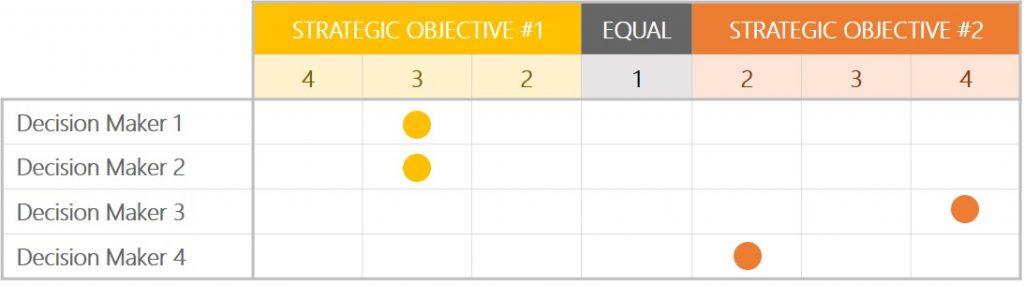
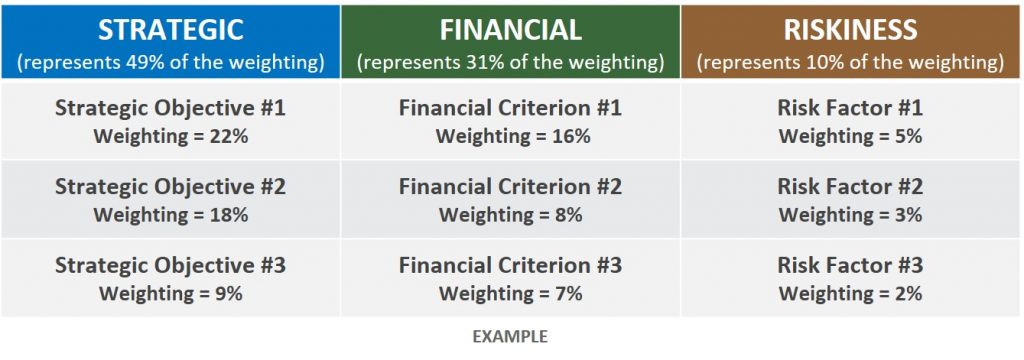
In the example below, each of the four qualitative values has a corresponding quantitative value. For each value, there is a definition to help determine to which value the project best aligns. If the governance team determined that a particular project has a medium alignment to strategic objective #1, it would score a 2. This is an important step for decision makers to prioritize projects and we will explore all of the calculations at the end of this post.

Prioritize Projects Using Anchor Scores for Strategic Criteria

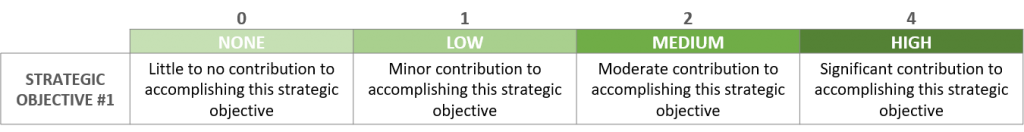
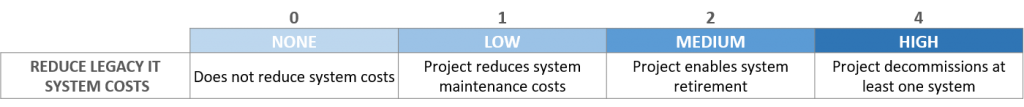
The definitions alone can significantly improve the quality of the project scores. The example below is relatively generic and requires the governance team to possess enough knowledge about the project and the strategic objective to properly determine the degree of strategic alignment. This can be problematic if the governance team “feels” that a given project has moderate to high alignment and therefore warrants a higher score. The scoring process is intended to make the prioritization process as objective as possible. This can be accomplished by more specifically defining the underlying criteria of “none”, “low”, “medium”, and “high”. In example #2, an IT department of a large Fortune 500 firm has a specific strategic objective to reduce the number of legacy computing systems. The criteria for each of the four options is far clearer with little need for interpretation. If the project actually decommissions a system, it scores “high”. As companies mature their evaluation process, the specific criteria for none through high can be enhanced.

Prioritize Projects - Detailed Strategic Scoring
Prioritize Projects – Detailed Strategic Scoring

For financial evaluations, it is important to set financial thresholds that will really set the winners apart. If the bar is set too low, too many projects will get “high” scores and the scoring model won’t be of much help to distinguish the highest value work.

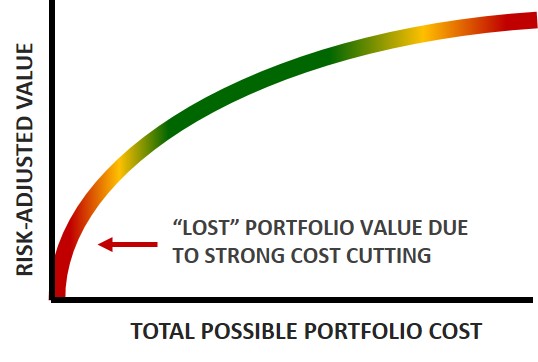
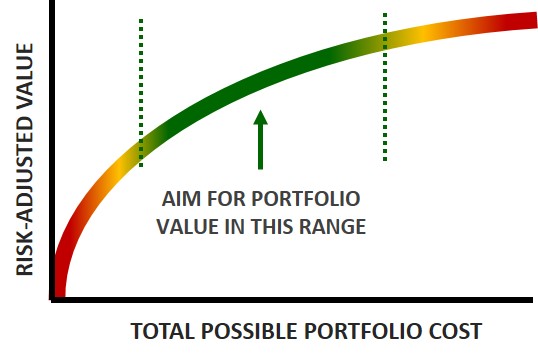
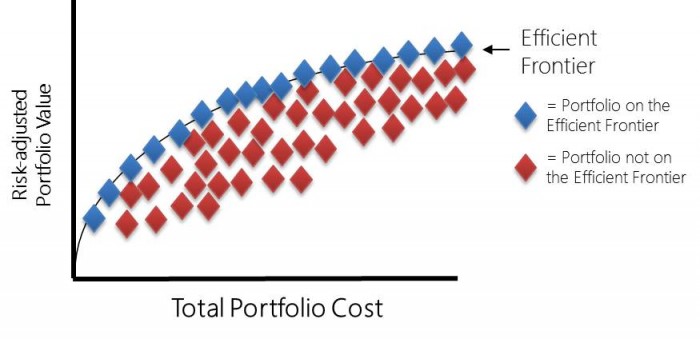
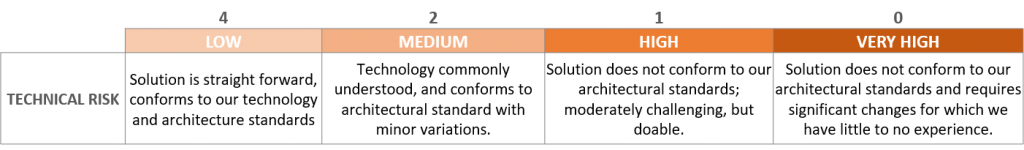
For the riskiness evaluations, we need to flip the quantitative values so that the highest number corresponds to the lowest risk qualitative value. By doing so, we are giving more value to less risky projects. This makes sense especially if we have two projects which may be nearly identical in value but one is far riskier than the other; under normal circumstances if we could only choose one over the other we should choose the less risky option (i.e. better risk-adjusted value).

Scoring Model - Risk Scores
Scoring Model – Risk Scores

For a free copy of these slides, sign up now.

Step 5 – collect all necessary information in order to prioritize projects

In order to evaluate projects or new proposals, some amount of information is needed to understand the scope, importance, alignment, cost, benefit, and risks of the project. Based on the actual scoring model you built and your current organizational processes, you may already have all the information you need to use the scoring model. In other cases, new information needs to be collected. Let’s break it out in further detail.

Strategic information: at some point during the intake/proposal phase, the project initiator for each proposal should have provided some rationale for how the proposed project aligns with one or more strategic objectives. Simply stating that alignment exists is not useful; there should be an explanation of how the project supports the organization’s strategic objectives. This information should be captured in a document for each governance team member to review. If this information does not exist (or does not exist for all current projects), the Project Sponsor can help explain strategic alignment when the governance team evaluates the projects. If most current projects are missing this information, the Project Management Office (or other team facilitating the prioritization process) should update organizational processes to include this information going forward.

Financial information: assuming that your scoring model utilizes quantitative financial information, it is very important to ensure that this information is available for all projects (a common challenge for many organizations). The best approach is to work with the Finance department to do some level of financial analysis to determine financial benefits for each project. This will lead to consistent financial information across the portfolio. Without Finance’s help, most organizations struggle to get meaningful financial benefits. The best alternative to getting Finance’s help is to provide spreadsheet templates to each project team to assist with calculating the financial metrics used in the scoring model.

Riskiness information: information about the inherent riskiness of the project is useful for conducting this evaluation. It is important to keep in mind that this assessment is not about the specific project risks (although this could be useful), but about the inherent risk nature of the project. Answering questions such as: “how much organizational disruption will this project cause?” “How much experience do we have with this type of project?” “Do we have a sufficient skill set internally to deliver this project?” are important to evaluate the riskiness of the project. Ideally, some of this information is contained in the business case, project proposal form, or even in a project charter.

Step 6 – Educate stakeholders on how to prioritize projects

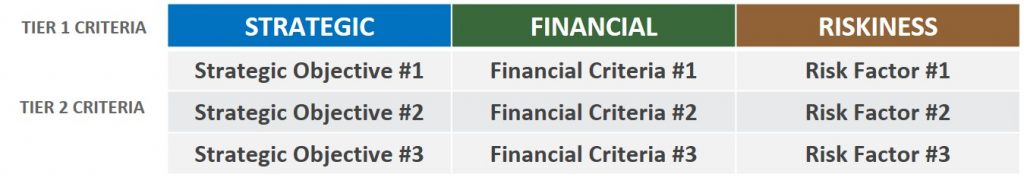
Everyone involved with evaluating and scoring projects must understand the relevant details of all projects in the portfolio in order to successfully prioritize projects. If your scoring model includes a strategic component, financial component, and riskiness component, we recommend the following roles for scoring projects:

  • Strategy: The Governance Team, representing the senior leaders of the organization is best equipped to evaluate the strategic value of each project
  • Financials: this is easily derived from the financial analysis and no additional evaluation is needed. A Portfolio Analyst or PMO Administrator should be available to compile this information and capture it in a single data repository.
  • Riskiness: The Project Manager or PMO Director will be in the best position to evaluate the riskiness of a project. The PMO Director could be the singular person to evaluate riskiness across all projects in the portfolio, which streamlines this evaluation. Alternatively, each Project Manager could evaluate and score individual and share the results with the Portfolio Analyst or PMO Administrator. A group of Project Managers could come together and work together to score their projects as individual Project Managers may interpret criteria a little differently.

In most cases, this requires a certain level of education so each project is fairly evaluated. This is not a small effort. Although the Governance Team may be sponsoring some of the current projects in the portfolio, they won’t be familiar with all of them. That will affect the team’s ability to evaluate and score the projects. Therefore, some level of education is needed to bring everyone up to speed. There are a few ways to accomplish this:

  1. Prepare summary information of each project for the Governance Team to read on their own before the meeting (examples include: business case, charter, etc.). The advantage of this approach is to expedite the scoring exercise.
  2. Prepare summary information of each project for the Governance Team to review during the meeting. Using this approach, the Governance Team would likely review a batch of projects and score them in the same session. The advantage of using this approach is that everyone will have dedicated time to review project information and discuss as a group. This option also takes longer than option 1.
  3. Conduct mini project reviews in a team meeting with the Project Managers in attendance to present and answer questions. The advantage of this approach is that it gives the Governance Team an opportunity to ask important follow-up questions as well as get to know the Project Managers better. This option takes longer than the previous two options.

Step 7 – Evaluate and Score

Tips for handling the evaluation and scoring:

  • Pilot the scoring with a handful of projects: pick a few representative projects (projects known to be high priority and lower priority, across various strategic objectives)
  • Conduct the pilot with the governance team in person: even after prioritizing criteria and discussing it as a team, there will still be questions about specific projects and how they align to the strategic objectives.
  • Build in adequate time for discussion: there will be different degrees of understanding of the projects and some projects will require more discussion than others. The value is in the discussion, so build in adequate time for discussion so participants do not feel rushed.
  • After the pilot, get agreement on how the governance team wants to finish scoring projects. Some teams will want to continue scoring as a group; others may want to do their scoring in advance and come prepared to discuss.
  • Take time to review and validate consistency of scores: some governance team members may be surprised about the scores of certain projects. It is not unusual for some medium and high scoring to be inconsistently applied. The group may have determined that a project was a “high” in one case but after review, it should really be a “medium” or vice versa.

In the next post we will cover the relationship between priorities and resources and the need to reinforce over-communicating priorities and how this affects resource allocation.

A Guide to Building a Project Prioritization Scoring Model

PRIORITIZATION IN THE CONTEXT OF PROJECT PORTFOLIO MANAGEMENT

Portfolio management is about maximizing organizational value delivery through programs and projects. In order to maximize value delivery, the governance teams that approve work and prioritize projects need to share a common view of “value” in order to use a scoring model to select the most valuable work and assign the right resources to that work. Understanding the relative “value” of each program and project in the portfolio is at the heart of portfolio management and determines what work is selected, how it is prioritized, where resources are allocated, etc. In order to select a winning portfolio, every governance team needs to share a common understanding of value; without it, you’ll fail to realize the benefits of your portfolio.

However, the definition of “value” will differ at every company because every company has different strategic goals, places varying emphasis on financial metrics, and has different levels of risk tolerance. Furthermore, even within a company, each department may interpret the strategic goals uniquely for their organization. Hence, “value” is not clear cut or simple to define. Any organization that manages a portfolio of projects needs to define and communicate what kinds of project work is of highest value.

Portfolio Management Lifecycle

The Scoring Model is the Prioritization Tool

The tool for assessing project value is a scoring model, which includes the criteria in the model, the weight (importance) of each criterion, and a way of assessing a low, medium, or high score for each criterion in the model. A good scoring model will align the governance team on the highest value work and measure the risk and value of the portfolio. A poor scoring model will not adequately differentiate projects and can give the governance team a false precision in measuring project value.

In the context of the portfolio lifecycle, assessing project value is particularly important in the first two phases: Define Portfolio Value and Optimize the Portfolio. When evaluating new projects for inclusion in the portfolio, the governance team must understand the relative value of the proposed project in relation to the rest of the projects in the portfolio; this will help inform the governance team’s decision to approve, deny, or postpone the project. Once there is an established portfolio, the same value scores can be used to prioritize work within the portfolio. For many organizations, the process of selecting projects and prioritizing projects is merged together to develop a rank order list of projects where the governance team “draws the line” where budget or resources run out is an acceptable way to define the portfolio. Unfortunately, this approach does not result in an optimal portfolio, but is acceptable for lower maturity organizations. Strictly speaking, we should distinguish portfolio selection from project prioritization and for the purposes of this post we will focus strictly on using the scoring model for prioritization.

Gaylord Wahl of Point B Consulting says that priorities create a ‘true north’ which establishes a common understanding of what is important. Without a clear and shared picture of what matters most, lower-value projects can move forward at the expense of high-value projects. Even though experienced leaders understand the need to focus on a select group of projects, in practice it becomes very difficult. Good companies violate the principal of focus ALL THE TIME and frequently try to squeeze in “just one more project.”

Prioritization is About Focus

Prioritization is about focus—where to assign resources and when to start the work. It enables the governance team to navigate critical resource constraints and make the best use of company resources. Higher priority projects need the best resources available to complete the work on time and on quality. Resources that work on multiple projects need to understand where to focus their time. When competing demands require individuals to make choices about where to spend their time, the relative priorities need to be obvious so that high-value work is not slowed down due to resources working on lower-value work. You have to be sure that your most important people are working on the most important projects so that you can get the most important work done within existing capacity constraints.

Furthermore, when resources are not available to staff all of the approved projects, lower priority projects should be started later once enough resources are freed up to begin the work. However, not all projects can be initiated immediately. Understanding relative priorities can help direct the timing and sequencing of projects. In some cases, high priority projects may have other dependencies or resource constraints that require a start date in the future. In other cases, lower priority projects get pushed out into the future. In both cases, schedule priority helps answer the question “when can we start project work?”  Remember, prioritization is about focus—WHERE to assign resources and WHEN to start the work.

BUILDING THE SCORING MODEL

Assessing project value is at the heart of portfolio management, and the scoring model is the tool to help assess value. Therefore, building a good scoring model is integral to prioritizing work. In fact, as we will see, prioritizing the criteria in the scoring model is a major component of the prioritization exercise.

Step 1 – Define the Scoring Criteria

The first step in building the scoring model is to identify and define the criteria in the model. In the past, expected financial benefits would be a singular way of measuring project value. Although this is a tangible and quantitative way to measure value, experience shows that merely selecting and prioritizing work based on financial benefits fails to yield optimal strategic results. In high performing organizations, value can include intangible (qualitative) factors such as the degree of strategic accomplishment, customer impact, and organizational benefits.  Therefore, we recommend a combination of quantitative and qualitative criteria. At the very least, your scoring model should include three categories of criteria: strategic alignment, financial benefit, and risk. This is your highest tier of scoring criteria (what we will refer to as “tier 1” criteria). Within each of these categories are the sub-criteria that will actually be used to evaluate projects (referred to as “tier 2” criteria). Why are two tiers of criteria needed? Let’s look at the strategic category. Some organizations simply want to evaluate the degree of strategic alignment, but since nearly all organizations have two or more strategic objectives, for the purposes of assessing project value, you should evaluate the degree of alignment across all of your strategic objectives. Projects that positively impact multiple strategic objectives are generally more valuable. In addition, having a discrete understanding of which strategic objectives each project supports will further enable the governance team to prioritize work. Each strategic objective is a sub-criterion (tier 2) used to assess project value. The three recommended scoring model categories are defined below.

Strategic Criteria: Portfolio management is focused on strategic execution, so measuring strategic alignment as part of your scoring model is important. This would include your organization’s strategic objectives.

Financial Criteria: All for-profit companies should incorporate financial benefit into the scoring model such as net present value (NPV), return on investment (ROI), payback, earnings before interest and taxes (EBIT), etc.

Risk Criteria: Finally, a good scoring model takes into account the risk factors of the project. These are not individual projects risks, but a measure of the “riskiness” of the project. Just like a stock portfolio, each investment carries a different level of risk. Remember, if you could only choose one of two investments that each have the same return, you will always go with the least risky option.

Scoring Model Criteria

Step 2 – Prioritize the Criteria

The second step is to prioritize the criteria from step 1. This is best done using pair-wise evaluations, a simple method of comparing two criteria against each other (also known as the Analytic Hierarchy Process, or AHP). This is easily accomplished in one on one sessions with each decision maker. This evaluation is perhaps the most important step in the entire process because it will not only determine the weighting of your scoring model, but even more it will test and ultimately align the governance team’s understanding of the organizational strategies. For example, when evaluating strategic criteria, the governance team will be asked to compare strategic objective 1 against strategy objective 2. On paper, everyone probably understands why each strategic objective is important but has probably not considered the relative importance of one strategic objective compared to another. Using AHP will force each person to really consider whether the two strategic objectives are equally important or whether one is truly more important than another (when making comparisons using AHP, a criterion can be equal to, twice as important, three times as important, four times as important, etc. to the other criterion). In the example below, Decision Maker #1 believes that strategic objective #1 is three times more important than strategic objective #2.

Scoring Model Prioritization

Step 3 – Review and Validate

The third step is to review the evaluations as a team. This exercise really highlights what is most important to each member of the governance team and affords a way for the governance team to have a common understanding of value. It is necessary to highlight where the biggest gaps are between the members of the governance team and discuss why each person holds their view. In this discussion, no one’s evaluation is right or wrong, but in the discussions as a governance team new information may come to light that helps everyone align to a common understanding of each strategic objective, financial criteria, and risk criteria. Based on experience, the strategic alignment discussion is of critical importance and can surface divergent views that would never have come to light without the pair-wise exercise. Without going through this exercise, it is impossible to determine if the scoring model truly represents the governance team’s understanding of value.

An example of a single comparison is shown below. In this example Decision Makers 1 and 2 believe that the first strategic objective is three times as important as the second objective. However, Decision Makers 3 and 4 believe that the second objective is four times and two times as important respectively. This governance team needs to come back together to discuss the discrepancies. The true benefit of this exercise is in the discussion that helps align the team to a common view of strategic value.

Scoring Model Evaluation

WARNING: It is tempting to skip these steps by arbitrarily picking scoring weights in order to quickly score and prioritize projects. One large company wasted hours in weekly steering committee meeting debating the weighting of each criterion. In the end, the excessive discussion wore down the committee; it did not produce the right discussion. Rather, focus on the relative value of each criterion compared to other criteria; the weighting will be a mathematical output of the pair-wise comparisons.  Additionally, if the governance team does not share a common understanding of value, the benefits of going through any prioritization exercise are greatly diminished and can cause more churn in the long-run. Based on experience with Fortune 500 companies, the pair-wise discussions are not only more effective but also more efficient (a single person can complete their evaluations in 15 minutes). The benefit is in the discussion among the governance team members to align on the criteria for evaluating project value.

By this point, the result of prioritizing the criteria is:

  • A governance team that has been calibrated around how to define value
  • A scoring model with criteria and weighting that has been validated by the governance team and can be accurately used to assess project value.

The simple example below shows what the weighting could look like after prioritizing the criteria.

Scoring Model Summary

In this post we have covered how to purposefully build a scoring model. The next post will cover the remaining steps in order to evaluate and score projects.

What is a prioritization scoring model?

The scoring model is a tool for evaluating project value. It is composed of multiple criteria to assess project value. The final score represents the numeric value of the project and can be used to compare against other projects within the portfolio.

Know The Difference Between Work Intake Versus Stage-Gate

What is the difference between a work intake process and a Stage-Gate process? This is important to distinguish, especially for newer PMO’s that are setting up portfolio management processes.

Work Intake

The work intake process refers to the steps of developing a project proposal and bringing it to the governance board (or PMO) for a go/no-go decision. This process works in conjunction with Stage-Gate, but can also be a standalone process. When PMO’s are first established, an intake process needs to be defined so that the PMO can manage incoming project requests. Once the portfolio governance team is established and familiar with the intake process, a full Stage-Gate process should be developed.

The work in-take process is important so that all project proposals are created in a consistent manner with common tools and processes.

The unintended consequences of not having a work in-take process include:

  • Organizational confusion—employees will be unclear on how project proposals get brought forward, resulting in fewer project proposals from within the organization
  • Time delays—without a clear understanding of the process, project proposals may be unnecessarily delayed from being reviewed
  • Quality erosion—the quality of the proposals may erode and further delay the process since participants may not be aware of the information needed for project reviews.

In order to have a successful work in-take process, all of the roles and responsibilities of each participant in the process needs to be documented and communicated. Some questions that need to be answered include: who will write the proposal (project manager, business analyst, executive sponsor)? What information is needed? What templates need to be filled out? What format must the information be presented? Are there any IT systems that need to be utilized (e.g. SharePoint, portal, portfolio management system)? Are there any time constraints for submitting proposals? Is a presentation needed? Who will make the presentation?

Another important reason to establish a work in-take process is to help control the work in progress (WIP) within the organization. At one Fortune 500 company I worked with there was no “single entry” to the organization. Rather, requests came in through system managers, process engineers, subject matter experts, and other employees. It was nearly impossible to track all of the work being done because there was no “single source of truth”. A lot of shadow work was being done in the organization and it was very difficult to stop it because there was no established or enforced work in-take process. This shadow work eroded portfolio value, took valuable resources away from key projects, and was ‘death by 1000 cuts”.

Work in-take success factors:

  1. Having a single “front door to the organization”
  2. Clear roles and responsibilities of all participants in the work in-take process
  3. Clear understanding of what information needs to be submitted
  4. Clear communication about the templates and systems need to be used (if applicable)
  5. Clear timetables for submitting requests and making presentations

Work Intake and Stage-Gate
Work Intake with Stage-Gate

Stage-Gate

Stage-Gates are a governance structure to evaluate, authorize, and monitor projects as they pass through the project lifecycle. Each gate represents a proceed/modify/hold/stop work decision on the part of the portfolio governance team. Although the Stage-Gate process parallels the project life cycle, the two are not exactly the same. For more information on the project lifecycle please see the Project Management Body of Knowledge Guide 6th Edition (PMBOK) by the Project Management Institute (PMI).

Stage-Gates are a critical component of project selection. A winning portfolio must contain winning projects, therefore the portfolio governance team must be able to discriminate between good projects and great projects. The decision gate process enables the project governance board to review these projects based on predetermined strategic criteria at each gate review of the Stage-Gate process. At each of those gates, important project information is provided to the project governance board to make a go/no-go decision related to the project. Without this mechanism, unnecessary or poorly planned projects can enter the portfolio and bog down the work load of the organization, hampering the benefits realized from truly important and strategic projects.

Conclusion

New PMO’s should start by establishing a work intake process to ensure there is one clear path for project requests to reach the PMO. Later, as the organization adopts the work intake process, a full Stage-Gate process can be added on to increase the quality of project proposals and help ensure the portfolio contains winning projects.

Portfolio Optimization—Data and Constraints

In our hyper-accelerated business world, data analysis and data visualization are exceptionally important. In the realm of project portfolio management (PPM) and PMO’s, organizations need robust data analysis to strengthen decision making and improve strategic execution. The key is to have the right processes in place to collect the right data and ensure that the data is of good quality. As I have said before, data collection is not free; any data that is collected but not actively used is a waste of organizational resources. Knowing what information is needed to drive better decision making will help ensure that only important data is collected. Therefore, organizations should wisely consider what metrics, analytics, and reports are most important to senior leaders and then develop or improve the processes that drive the collection of that data. The power of having good portfolio data is to conduct strong portfolio optimization.

3 LEVELS OF ANALYSIS

Once organizations have a stable foundation for PMO/PPM data collection, they can embark on the data analysis journey. The graphic below highlights three levels of data analysis:

  • Descriptive analysis—this helps answer the basic “what has happened?” This level of analysis is the most basic as it is fact-based and is required for developing key performance indicators and dashboards.
  • Predictive analysis—this helps answer a more important question, “what will happen?” With sufficient data, organizations can begin to predict outcomes, especially related to project risk and project performance and the impact to project delivery as well as the portfolio as a whole.
  • Prescriptive analysis—this helps answer a more difficult question “what should we do?” This requires more detailed and advanced analysis to determine the optimal path against a set of potential choices. Prescriptive analysis of the portfolio provides significant benefits by enabling organizations to choose the highest value portfolio and choose a group of projects with a higher likelihood of success.

pmo-analytic-capabilities

PORTFOLIO OPTIMIZATION

Portfolio optimization is major part of the prescriptive analysis described above. Organizations should endeavor to get to this point because it delivers substantial value and significantly improve strategic execution. In order to optimize any part of the portfolio, organizations must understand the constraints that exist (e.g. budgetary, resource availability, etc.). These constraints are the limiting factors that enable optimal scenarios to be produced. There are four basic types of portfolio optimization described below:

  1. Cost-Value Optimization: this is the most popular type of portfolio optimization and utilizes efficient frontier analysis. The basic constraint of cost-value optimization is the portfolio budget.
  2. Resource Optimization: this is another popular way of optimizing the portfolio, and utilizes capacity management analysis. The basic constraint of resource optimization is human resource availability.
  3. Schedule Optimization: this type of optimization is associated with project sequencing, which relates to project interdependencies. The basic constraints of schedule optimization are project timing and project dependencies.
  4. Work Type Optimization: this is a lesser known way of optimizing the portfolio, but corresponds to a more common term, portfolio balancing. The basic constraints of work-type optimization are categorical designations.

APPROACH

The following diagram summarizes the above points and highlights how having the right data inputs combined with constraints and other strategic criteria can produce optimial outputs across four dimensions of portfolio optimization.

PMO Analytic Framework for Portfolio Optimization

Point B Consulting’s 5-step methodology for conducting PMO analytics enables organizations to realize the full potential of their analytic processes.

  • Define: Determine the performance criteria for measuring PMO/PPM success and develop a set of questions / hypotheses for further modeling and investigation
  • Transform: Gather and transform all available resource, project, business data for further visualization and analysis
  • Visualize: Inventory all projects with related resources and highlight key trends/insights based on project and business data
  • Evaluate: Develop analytic framework to test, adjust, and optimize against tradeoffs between project sequencing, resource allocation, and portfolio value
  • Recommend: Develop a final set of project prioritization recommendations for desired future state

In summary, portfolio optimization delivers significant strategic benefits to any organization, but getting the right processes in place to collect good data is not easy. Having the right data can enable your organization to know what is happening to the portfolio (descriptive analysis), what could happen (predictive analysis), and what senior leaders should do (prescriptive analysis).

Improve Portfolio Health By Avoiding Two Portfolio Management Extremes

Two Simple Questions

You can measure your general portfolio health with two simple questions:

1) Do you approve all or almost all of your projects?

2) Are you approving so few projects that people would say you are “cutting to the bone”?

These are two portfolio management extremes that we will examine in this post.

Approving Everything is Bad

Question number one highlights a common trap for many companies, approving all or almost all projects that get reviewed.  This indicates that the project selection process is not working well. When governance councils have a project approval over 90%, it means very few projects are getting screened out and some poor projects are probably getting approved. Approving nearly all projects also means that significant diminishing returns kick in for this group of projects and executing this work likely requires unnecessary multi-tasking and exceeding the resource capacity of critical resources. While it is theoretically possible for an organization to do an outstanding job of selecting the best possible project candidates upfront and still have a high approval rate, I doubt this occurs very often. More likely, organizations operate in a reactive mode and approve projects as they get proposed; since most projects look good by themselves and almost always have a good reason for getting initiated, the project gets approved and funded. Therefore, one of the best portfolio governance council metrics to measure portfolio health is the project approval rate. We can illustrate these concepts with the graphic below.

Portfolio Cumulative Frontier - Extreme 1
Portfolio Cumulative Frontier – Extreme 1

Here we have a bounded curve of possible portfolios (in this case we can apply the cumulative frontier, which is the cumulative portfolio value based on the rank order of projects in the portfolio, not to be confused with the efficient frontier which is based on portfolio optimization). At the upper far right is the problem area in question. If organizations are approving most projects it means there is little to no discrimination among projects which is a symptom of not having enough project candidates to review and stems from poor ideation, work intake, and weak phase-gate processes.. When organizations have more project candidates than they can reasonably take on, the governance council is pushed to do a better job of selecting projects. Organizations can still do a poor job of selecting projects (or may simply ignore resource capacity and continue approving everything) even when they have more than they can take on, but the emphasis here is on increasing the project pipeline so that the governance council will become less reactive and more proactive and say no to projects that really should be screened out. Creating a strategic roadmap to identify important projects (top-down approach) combined with an employee ideation (process bottom-up approach) will help build up the pipeline of projects and increase the decision making rigor by the governance council.

Don’t Cut to the Bone

We can also evaluate portfolio health by looking at the other extreme where an organization is cutting costs so much that any further cuts will hurt the organization’s day to day operations (aka “cut to the bone”). In one place I worked, the cost-cutting measures had been in place for years and a number of good project candidates were hardly under consideration because funds simply were not available and a buildup of project requests was accumulating. A few high value projects got approved, but “money” was left on the table as a result of not taking action on those good project candidates. In some cases, the rigor to do a good cost-benefit analysis is absent and makes it difficult to communicate how much ‘value’ is being ignored by not taking on additional projects due to strong cost cutting measures. Such extreme cost cutting also has the negative residual effect of discouraging innovation among employees. We can also illustrate this with the same graphic.

Portfolio Cumulative Frontier - Extreme 2
Portfolio Cumulative Frontier – Extreme 2

Summary

In short, asking simple questions about the approval rate of projects and the cost-cutting measures of an organization can highlight general portfolio health. In both cases, organizations should be pushing toward the middle. Adding more project candidates will help ensure that only the most valuable projects get approved. In the case of extreme cost-cutting, companies should improve their ability to measure project value in order to communicate the ‘value’ left on the table. This is best accomplished when a company is doing reasonably well and not when the company is truly in dire straits. Cutting costs “to the bone” is never a good way to stimulate innovation, therefore careful attention is needed when companies are cutting costs too much and not investing in the future.

Cumulative Frontier - Healthy Portfolio

Portfolio Reports – Portfolio Bubble Charts

This is the third post in a series on portfolio management reports. In the first post, we reviewed introductory portfolio management reports that convey the basic dimensions of the portfolio. In the second post we reviewed treemaps and advanced pareto charts that can help identify outlier projects worthy of more scrutiny. In this post we will look at the most common report for project portfolio management, portfolio bubble charts.

SUMMARY

The risk-value portfolio bubble chart represents a portfolio view of all projects and puts projects into one of four quadrants based on value and risk; this is important for identifying projects that drive overall greater value to the organization compared to other projects as well as highlight projects that should likely be screened out.

BENEFITS OF PORTFOLIO BUBBLE CHARTS

One of the key benefits to a portfolio bubble chart is to quickly show the balance of the current portfolio.  Using portfolio bubble charts with the portfolio governance team can focus conversations to help better manage the portfolio. When reviewing projects that are in the higher-value/ lower-risk quadrant, the portfolio governance team should ask the question, “how can we get more of these types of projects in the portfolio?” Likewise with the lower-value/higher-risk projects, the portfolio governance team should ask how to avoid those types of projects. These discussions will greatly enhance the management of the portfolio and enable the portfolio governance team to “manage the tail” and ensure that only the best projects are selected and executed.

DATA NEEDED

There are four primary data elements needed to build the risk-value bubble chart: value scores for each project, risk scores for each project, categorical data, and the project cost or financial benefits of the project (commonly used for bubble size). In an older post, I wrote in detail on how to build such a chart in Excel and the notion of normalizing the data. A prioritization scoring mechanism is typically required to build the best portfolio bubble charts.

Portfolio Bubble Chart Example

Portfolio Reports – Part 2

In the previous post, we reviewed very basic portfolio reports that can easily generated with initial data. In this post we will continue examining portfolio reports with an emphasis on intermediate level reporting.

Pareto Chart (Financial Contribution)

All companies should have a breakdown of project cost, but not all companies capture project value. For those that do, a Pareto chart ordered by financial contribution (e.g. NPV) provides aggregate portfolio visibility of the most valuable projects. We also find that the 80/20 rule often applies (20% of the projects deliver 80% of the portfolio’s value). This type of Pareto chart provides great visibility of the entire portfolio and highlights how a subset of projects support overall financial contribution.   It is a great report for focused discussions regarding how to manage the long tail of low value projects. It is critically important for the portfolio governance team to recognize this tail of projects and how to deal with it. The minimum required data to generate this report is a financial metric (cost, dollar savings, NPV, etc.) and the Project Name or ID.

Advanced Pareto Chart

We can take this Pareto chart a step further and overlay additional data points to make it an even more powerful report. In the example below, we have overlaid the cumulative R&D labor (as a percentage of R&D labor across all projects). By adding in this additional resource data, we can clearly see that we can still achieve 80% of the total portfolio value with only 65% of the anticipated R&D spend. In the absence of portfolio optimization, this insight can be valuable when managing bottleneck resources as it points to additional projects that can be accomplished without the use of critical resources. You can substitute R&D for any other role in your company that is a bottleneck to many projects.

These enhanced portfolio reports provide great visibility of the entire portfolio and how a subset of projects support overall financial contribution.   It is an even better tool for focused discussions regarding how to manage “the tail”. All you need is the following data: Financial metric (cost, dollar savings, NPV, etc.), project name/ID, Resource data or other categorical measurement.

Advanced Portfolio Pareto Chart

Treemaps

Treemaps offer a graphical alternative to traditional risk-value bubble charts and provides a quick glance of the entire portfolio with categorical information included (e.g. box size = cost, color = project value, grouping by category). The basic information may be similar to traditional bubble charts, but the coloring and sizing can raise awareness of different problems or challenges in the portfolio and is a great report for identifying misaligned projects. I recommend using treemaps in addition to bubble charts (which we will discuss in the next post).  Treemaps are common in data visualization software such as Tableau and requires data such as: financial measure (cost, revenue, savings), risk measures (optional), project value (e.g. a value score). Instead of coloring based on value score, you could color based on alignment to particular strategic objectives or by business unit. The example below shows a basic cost/value treemap.

Portfolio Treemap Example

Summary

In this post, we have seen two great intermediate portfolio reports that will enhance governance discussions. These reports help move senior leaders away from a singular project view to an aggregate project view. Even though we adjust individual portfolio components (aka projects), our view is to identify an optimal portfolio.

Are you using advanced Pareto charts and treemaps in your portfolio meetings? Share a comment below.


Portfolio Reporting Part 1

In a previous post, I wrote that from a very pragmatic point of view, getting the right data to leadership at the right time is at the heart of good project portfolio management. If the right data is not available for decision makers to use, the issue will be mediocre results at best. In actuality, the right data needs to be used to create the right reports to support strategic decision making. Hence, strong portfolio reporting must be a core capability for any organization utilizing portfolio processes. If you are not creating the right reports, then how well is your portfolio process actually working?

In the next few blog posts we will look at various types of portfolio reports, starting with basic reporting and concluding with advanced reporting.

In this first example, we will look at basic bar charts, which can represent subsets of projects in multiple dimensions:

  1. By Strategic Goal
  2. By Project Type
  3. By Sponsoring Business Group
  4. By Sponsor

The intention is to provide a quick visual overview of a certain category of projects (e.g. that align to a strategic goal or which belong to a certain sponsor). These charts provide a quick glance of projects sliced in different ways. There may not be much insight, but simple charts like this could highlight possible gaps in the portfolio and are useful for focused discussions around certain types of projects.

Basic Portfolio Report 1

The next set of basic portfolio reports focus on portfolio metrics. Pie charts of portfolio data are very easy to pull together and can be viewed categorically in different ways:

  • Projects By Category (Count, %)
  • Projects by Category (Cost)
  • Projects by Category (Value generated)

Some categorical examples include: health status, project type, strategic goal, sponsor, organization

Pie charts are really just a snapshot in time, but when data is collected over time, we can also graphically depict trends, which can uncover portfolio gaps. Such gaps highlight areas that need more governance attention and help facilitate focused discussions around managing the portfolio.

Organizations need to collect the following data in order to create these reports: categorical data, financial metric (cost, value, etc.), resource hours, etc.

Basic Portfolio Report 2

In the next post we will look at more intermediate portfolio reports.  In the meantime, what are your favorite portfolio reports? What has worked well for your organization?

Benefits of Social Collaboration

The Potential for Social Collaboration

Innovation is a hot topic in business right now with an ever growing need for companies to deliver better products and services.  A key ingredient for fostering innovation is enterprise collaboration. Until a few years ago, collaboration was often limited to smaller teams, but this could introduce a higher risk of duplicative efforts occurring simultaneously in larger companies. With the development of enterprise social networks (ESN’s) comes improved collaboration to include all employees across all organizations thus significantly increasing innovation and quality across the company.

The promise of enterprise social collaboration comes from the power of the network with the ability to tap into the collective brain trust of the organization. The potential payoff for corporations is enormous as indicated by a 2012 McKinsey report identifying a potential for over $1 trillion in new business value to be created annually through the use of enterprise social networks (e.g. improved product development, work efficiencies, etc.)

Social Collaboration for Portfolio Management (PPM)

The 4 C’s of Social Project and Portfolio Management

In the context of project and portfolio management, social tools impact employee connection, communication, collaboration, and community (also known as the 4 C’s).

  1. Connection

The power of the network begins with having the right connections in the organization. Social tools enable employees to connect with a broader group of colleagues than would otherwise occur in day to day work. User profiles provide additional detail around work history, education, and other personal information that foster stronger connections on a professional and personal level. Project managers with a larger number of connections have a greater pool of resources to choose from when building out their project team as well as quickly identify subject matter experts to assist in critical phases of work.

A good project portfolio social platform can also alert users of other people who have managed similar risks and issues, or have worked on similar product lines or IT systems. By making these types of connections, project managers can reach out to the right people at the right time for help and leverage proven solutions rather than losing time developing a duplicate solution that already existed.

  1. Communication

Email is still the predominant form of business communication (per Email Statistics Report, Radicati) with over 100 billion business emails sent each day. Tremendous amounts of business knowledge is trapped in the inboxes of employees and is not searchable by other knowledge workers who would benefit from accessing those key conversations. Alternatively, conversations, discussions, and answers to questions within social platforms become searchable content that is continually being enriched by the users of the social platform. Project teams can proactively search for new information to discover other teams that have encountered similar challenges, learn how they solved problems, and re-use successful solutions. This fosters further communication and improves project delivery and quality.

  1. Collaboration

One of the promises of enterprise social networks is the ability for a broader group of people to work collaboratively within and across project teams. At the portfolio level, the quality of new project proposals increases substantially when employees can collaborate (“crowdsource”) on new ideas; great ideas can generate a lot of traction and be improved even before reaching a governance committee. At the project level, team members have greater visibility of work in progress and can comment on deliverables and other project work. These comments are made visible to other team members who can further build upon those comments to improve the overall quality of the work.

  1. Community

In addition to improving communication and collaboration at the project level, social communities can spring up around areas of common interest where participants can ask questions, share ideas and learn from one another. This further strengthens connections, communication, and collaboration. One example is a project management community of practice that can promote project management best practices across an enterprise. This not only uplifts the quality of project management within the company but creates a way for senior project managers to share valuable experience with younger project managers, who in turn, have more opportunities to develop and grow in their profession.

Challenges to Social Collaboration

The top two challenges to successfully establishing social collaboration are developing a collaborative culture and sufficient leadership engagement with social tools. In actuality, senior leadership is responsible for both.

Large scale social collaboration cannot and will not occur without an organizational culture of collaboration. Unless senior leadership fosters a culture of collaboration, most employees will be too focused on their day to day work to devote any attention to collaboration. Without this culture, there won’t be any true incentive to collaborate and any encouragement to use social collaboration tools will feel like a tax on people’s time to switch back and forth between traditional email and new social tools.

Additionally, senior leadership cannot merely sponsor a social collaboration initiative; rather, they need to lead by example to use the tools, which will have a powerful effect on the organization. When senior leadership demonstrates greater transparency and communication through the use of social tools, the rest of the organization will follow suit.

My Perspective

Changing an organization’s culture and the behavior of senior leadership are both very difficult. Only a concerted effort of organizational change management can redirect a company toward collaboration. Such change must be of high enough priority that it affects the daily behavior of senior leadership to embrace enterprise social networks. Based on Dr. John Kotter’s change model, senior leaders need to establish a sense of urgency around social collaboration. There must be a powerful guiding coalition to create a shared vision and communicate it across the organization. Then, both leaders and employees must act on the vision and rally around demonstrative, short-term wins.

The Bottom Line

Enterprise social networks have tremendous potential to improve project and portfolio management effectiveness—but only when the company possesses a culture of collaboration. Senior leadership is uniquely responsible for ensuring that such a culture exists before implementing social collaboration tools and must lead by example to improve adoption. With strong leadership and a collaborative culture, your organization can reap the many benefits of social collaboration in the context of project and portfolio management. This will result in a smarter and healthier company.

Strengthen Talent Management With PPM

Talent Management3Is It Just About Talent Acquisition?

When people refer to the “war for talent” many discussions center on talent acquisition and try to answer the question “how do we hire the best people?” Although talent acquisition is important, talent development and retention are also very important (you want to keep those great people you hired, correct?). Hiring good people is not the most challenging part; because the war for talent is real, retaining talented people is difficult. This is where project portfolio management (or “PPM” for short) strengthens the traditional HR approach to talent management.

In a recent LinkedIn discussion, Emily Smith asked a broad question on how PPM software can impact unemployment rates. My response was that portfolio management as a discipline and PPM software with the right data can significantly improve talent retention and development.  Before we continue down this path, let me quickly summarize project portfolio management. PPM is firstly about doing the right work to accomplish strategic goals, and it is also about focusing resource attention on high priority projects while balancing overall resource capacity. In larger organizations you can imagine how difficult it is just to monitor all of the project work going on and ensure that each project is on track to completion. However, with a little extra focus (and the right software), organizations should also monitor the skills and abilities of the people doing the work and assign people to projects that align with their interests and help them grow professionally. These last points are often after thoughts in project management because of the sheer focus on simply getting work done.

The Value of PPM to Talent Management

Consider for a moment the value to performance management of having an employee report show all of the projects they have been involved with over the last several years with the strategic importance to the organization, the complements given by their project teammates, the skills they have improved and developed, the degree of alignment to professional areas of growth, and even the people mentored during those projects. That would be powerful, and if used correctly, would send a strong message to employees that this company enables them to grow professionally and make a difference through their work. Wow.

Sadly, I don’t know if this system exists. Current HR management systems are not designed as portfolio management systems that would track this level of project detail.  Even having a system that a project manager could use to do a search across the company for people who have particular skills and experience for a new challenging project would be a great enhancement over what we have today—assigning spare bodies just to keep up with the flood of work going on.

Project portfolio management complements and enhances talent management. Do you agree? Tell me how well your talent management processes are going, especially if there is any linkage to project and portfolio management.


Talent management graphic courtesy of Lean Home Care

Resource Management and Capacity Planning Handbook

Book Review

The Resource Management and Capacity Planning Handbook by Jerry Manas is the authoritative source for any organization wanting to improve its resource management practices in the context of portfolio management.  The opening chapter does a great job of providing basic context of resource management and capacity planning and strongly leverages a benchmark study by Appleseed RMCP and expert practitioners in the field.

Organizations continue to struggle with the matter of resource management and “when you consider the constant change, lack of visibility into resource capacity, and no sense of which work is most important, the result is a perfect storm of resource management chaos.” In order to address this problem, Manas systematically covers key topics chapter by chapter that provide relevant help to companies seeking to improve. This book is not about mere theory, but gives literally hundreds of practical points based on corporate reality.

Chapter 2 addresses the road to maturity for improving resource management. I am a big believer in assessing organizational maturity, and Manas does a great job of acknowledging that organizations are on a road to maturity, and through the help of expert practitioners, gives examples of how organizations have matured their resource management processes.  The chapter also addresses the matter of time tracking and does an excellent job of providing a balanced view of why to do it and how to make it work.

In chapter 3, Manas presents a systems approach for diagnosing the root causes of poor resource management. He brings out a number of points that should strike a chord in any organizations. In the latter half of the chapter, he uses systems thinking to deep dive on estimating resources and tasks. The Resource Management and Capacity Planning Handbook demystifies the complexities of resource capacity and demand management and offers clear ways for maximizing your limited resources to drive business growth and sustainability.

Chapter 4 addresses the much needed topic of leadership and organizational change management. I was very pleased to see an entire chapter devoted to these two subjects, because most of the time in portfolio management literature, the emphasis is either on process or tools, with little regard for the people dimension (which is very critical). Much of the chapter is spent on the “50 ways to lead your users”, which is a systematic and structured approach to leading change in the organization.

Chapter 5 addresses key roles for making resource management and capacity planning successful. One of the key takeaways is that successful organizations very often have dedicated resources to support capacity planning exercises. He also takes time explaining the expanding role of the PMO.

Chapter 6 is an enjoyable chapter on strategic alignment and how not to manage resource capacity management like failed military leaders in the past.

Chapter 7 is a great chapter focusing on the human side of resource management. As chapter 4 addressed the people side of leadership and change management, this chapter does an equally good job of explaining why it is important for organizations to pay attention to the human side of project execution and resource productivity when trying to improve resource management.

Chapter 8 expands upon a white paper Manas wrote called “the Capacity Quadrant”. This chapter speaks more frankly about the topic of portfolio management and the need for visibility, prioritization, optimization, and integration of the portfolio. I loved his white paper on the topic and felt that this chapter could have been moved up earlier in the book to provide a clearer view of resource management and capacity planning within the context of project portfolio management.

The final chapter, chapter 9, concludes with industry specific challenges of resource management and capacity planning. This chapter turned out to be the cherry on top as it provided insight into unique challenges faced by different industries. Learning about challenges faced by other industries actually gives greater context to the capacity planning problem and puts readers on the alert for identifying and solving these problems in their own company.

My Conclusion to Resource Management and Capacity Planning

The Resource Management and Capacity Planning Handbook is a must-have book for PMO directors and senior leaders struggling with making the best use of limited resources. Jerry Manas has a great writing style that makes the book easy to read and easy to understand. He also does a fantastic job of blending theory with reality by explaining key topics and then providing numerous tips on how to be more successful with resource management.

Rating: 5 out of 5 stars

Communicate Portfolio Value

I recently finished a project helping a CPG organization within a large retail company implement a product portfolio management process. The company as a whole tends to avoid developing business processes, but this CPG organization recognized the need for greater process discipline around its product pipeline and work in-take. Any endeavor to implement portfolio management can be difficult due to the organizational change component, but one factor that makes it easier is to communicate portfolio value.

Portfolio communication is a significant component of good portfolio management and often requires communicating along the four PPM lifecycle steps shown below:

Communicate portfolio value

However, as it relates to managing organization change, to communicate portfolio value is to communicate how the portfolio process benefits the organization. Success stories must be shared to reinforce how new changes should be welcomed and adopted.

Communicate Portfolio Value Through Success Stories

Within the first few weeks of the new process, a project manager told his peers that the work in-take processes actually helped him determine that a new product he was about to propose was not a good project after all. He elaborated by saying that the extra rigor required him to ask tough questions about the value of the project, which led him to the conclusion that his proposed product was not worth bringing to market! Prior to a product portfolio approach, numerous project managers would have brought forth new product ideas with little governance or oversight. Now, with greater scrutiny over new product proposals, it was easier to determine early on whether a product idea was worth going after or not. This kind of testimony should be widely circulated throughout the organization to help communicate the value of the portfolio process.

Another project manager approached me recently to share another success story about how his project team believed that making a change to a single product would result in a one-time costs saving of $100,000. However, as a result of the increased cross-functional collaboration required by the new Stage-Gate process, the project team discovered that these changes could be applied to an entire product line resulting in an annual savings of $1,000,000. This was a huge win for the team and is another success story to help the entire organization adopt the Stage-Gate/product portfolio process.

Summary

To communicate portfolio value is not just about communicating the value of the portfolio, or of the individual project components in the portfolio, it also involves communicating the value of the entire portfolio process. This creates positive momentum for helping organizations adopt new processes, resulting in greater success in the future.

Who in your organization manages portfolio communication? How effective is the portfolio communication at your company?

Portfolio Review Meetings

Portfolio Review Meetings

Portfolio review meetings are a great way to review and assess the entire project portfolio with the governance team. Unfortunately in practice, these meetings can be overwhelming, time consuming, and unproductive. There are many ways to conduct a portfolio review meeting, but one of the key questions of the governance team is “what do they want to accomplish at the end of the portfolio review”? For some organizations, portfolio review meetings are about getting project status of every project in the portfolio. For other organizations, portfolio review meetings are designed to evaluate each project in the portfolio with the intention of updating priorities.

Options for Portfolio Review Meetings

With this background in mind, we can look at four options for conducting portfolio review meetings:

  • OPTION 1: A review of all in-flight projects, current status, relative priority, business value, etc. Some projects may be cancelled, but the primary purpose is to inform the LT of the current in-flight projects.
  • OPTION 2: A partial review of projects in the portfolio consisting of high-value/high-risk projects. This provides more in-depth information of critical initiatives and may result in a possible change of priority of certain projects.
  • OPTION 3: A high-level review of all projects in the portfolio with the intention of updating project priorities for every project in the portfolio.
  • OPTION 4: A review of portfolio scenarios that meet current business needs followed by a selection of a recommended portfolio

Option 4 comes courtesy of Jac Gourden of FLIGHTMAP in a 2012 blog post and is the best approach I have seen for conducting portfolio review meetings. I also have sat through long sessions (although not all-day sessions) of reviewing all the projects in the portfolio and it can be painstakingly tiring. Moreover, these types of portfolio review meetings wear out governance team members and do not yield much value.  While there is certainly a time and a place for review the status of all projects or conducting a lengthy review for the purpose of re-prioritizing projects in the portfolio, taking a strategic view is the way to go. Rather than merely focusing on individual projects, a portfolio team can compile a few portfolio scenarios that should be reviewed by the governance team. In many instances, there is significant overlap between the portfolio scenarios, but the emphasis is on the business goals of the portfolio and how a portfolio scenario supports a certain goal. Some examples of portfolio scenarios include:

  • Revenue Growth Scenario
  • Customer Growth Scenario
  • Market Growth Scenario
  • Reduced R&D Spend Scenario
  • Balanced Portfolio Scenario

These scenarios are easier to produce when efficient frontier analysis is applied. Even after a portfolio recommendation is accepted, there is further work to screen out the projects not included in the portfolio, and in some cases to make worthy exceptions for some projects that would have otherwise been removed from the portfolio.

What do you think? Have you tried this approach before? How successful was it? Let me know.

Increase the Value of PPM Systems

Today’s Environment

Project portfolio management (PPM) helps organizations make decisions that move the needle toward achieving their strategic objectives. In order to make those decisions, senior leadership needs the right information at the right time. This is where PPM systems come in, providing the quality data helping to inform sound decision making. Unfortunately, many companies assume that merely implementing a PPM system will improve their ability to execute strategy. There’s more to it.

Point B’s Perspective

In order for PPM systems to add value, organizations need to consider five important factors: business drivers, reporting, data, processes and people.

How to increase value from PPM Systems

Read the entire article here


Gate Review Filters

Phase-gate reviews improve project selection. If an organization wants a winning portfolio then the governance team must select winning projects. Therefore the project governance board must be able to discriminate between good projects and great projects. The phase-gate process enables the project governance board to review these projects based on preselected strategic criteria at the gate reviews of the decision gate process. At each of those gates, important project information is provided to the project governance board to make a go/no-go decision related to the project. Without this mechanism, unnecessary or poorly planned projects can enter the portfolio and bog down the work load of the organization, hampering the benefits realized from truly important and strategic projects.

The ability to screen out misaligned projects is based on the types of decision making criteria used for gate reviews. Another way to look at the criteria is that they act as gate review filters.  For instance, some companies may have no filters and approve every project; another company may only judge projects based on financial contribution and screen out very fewer projects; whereas other companies will makes gate decisions based on financial contribution, investment risk, and resource availability. We can see this by the image below.

Gate Review Filters

Types of Gate Review Filters

There are many types of decision making filters available for companies to use, the key is to apply the filters that match the organization’s current maturity and culture. Let’s take a look at a few gate review filters (not an exhaustive list):

1)      Financial filter: this gate criteria requires some sort of financial analysis to determine the profitability (or value) of the project. Applying financial hurdle rates may be one way of screening out lower value projects. Using financial benefit (e.g. net present value) is one approach to rank ordering projects.

2)      Strategic filter: most companies implementing PPM recognize the need to evaluate projects in light of strategic goals and objectives. However, if the criteria is not detailed enough, most projects can be shown to align to strategy to a certain extent.

3)      Risk filters: risk criteria at gate reviews should really be thought of as investment risk. Detailed project risks may or may not be known, but based on the type of project being proposed and the initial analysis the riskiness (or risk nature) can be understood. Depending on the risk tolerance of the organization, more projects may be screened out based on the riskiness of the project.

4)      Resource filters: a more advanced criteria is resource availability or the utilization of key resources who are currently unavailable. Since many organizations do an inadequate job of measuring resource utilization, this filter may not be used as often.

5)      Portfolio filter: for simplicity, a portfolio filter takes an aggregate portfolio view when reviewing individual projects. It measures what the impact to the portfolio is rather than only evaluating the individual merits of the project. It also relates to the balance of the portfolio (short-term versus long-term, risky versus safe, good distribution among business units, etc.).

As organizations mature their project selection process, more gate review filters (criteria) should be used to ensure that right projects get included in the portfolio. More criteria often means fewer projects get approved which means that the project pipeline more closely resembles a “funnel” rather than a “tunnel” (see this post for details).