Project prioritization is one of the most common topics in portfolio management literature. Within the context of project prioritization is the matter of scoring models because scoring models are the most widely used approach to prioritize projects. Although there are a lot of opinions on the effectiveness of common scoring models, they are nonetheless the most common method for prioritizing projects. However, most people may not realize the many uses of a scoring model and how it drives better decision making beyond project prioritization. In this post, we will look at five uses of a scoring model.
1) Project prioritization is the most common reason for using scoring models. As we saw in a previous post, project prioritization is for resource allocation. Since portfolio management is about delivering the most business value through projects, it is logical to ensure that resources are spent on the most important work. Ranking projects helps provide a common understanding of what is most important in the organization and scoring models are one of the easiest ways of establishing a rank order. For more information on using prioritization scoring models to rank order projects, please see Mastering Project Portfolio Management.
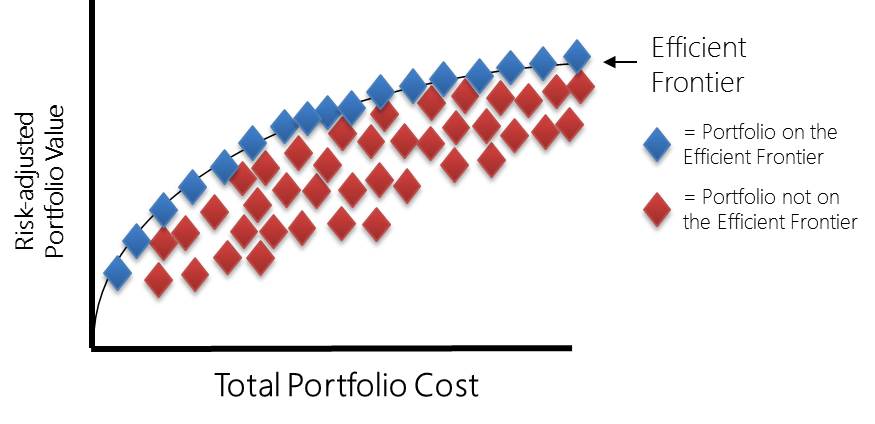
2) A prioritization scoring model is also used for project selection. The idea is to rank projects from highest value to lowest value and select projects until resources run out. This approach has merits over other approaches that do not sufficiently take account of strategic drivers. However, it can be shown that even simple optimization techniques can yield a higher value portfolio at the same cost. For organizations that do not employ portfolio optimization techniques, using a scoring model to rank order projects and fund projects until resources runs out is a reasonable way to go.
3) Portfolio optimization is very useful for identifying higher-value portfolios than merely using scoring models as discussed in the previous paragraph. The scores for each project can represent a “utility score” which can then be used as the input for the optimization calculations. In this way, projects are optimized based on all the scoring inputs, not merely on net present value or some other financial estimate. For more information about this technique, please refer to Richard Bayney’s book Enterprise Project Portfolio Management: Building Competencies for R&D and IT Investment Success.
4) A prioritization scoring model can also be used to make go/no-go decisions at gate review meetings. There are at least two ways to accomplish this:
A) Organizations can predetermine a threshold score that projects must exceed in order to be considered for inclusion in the portfolio (known as a scoring hurdle).
B) An alternative approach is to use a scoring range to provide better input to the decision makers. In other words, if the scoring range were from 0 to 100, scores below 30 might represent high-risk/low-value investments that should otherwise be rejected, but may only get approved if there were other intangible factors not considered by the scoring model. Projects in the middle range of scores might be approved with more scrutiny, and projects in the upper range would likely get approved. The prerequisite to taking this approach is to have an adequate number of historical scores from past projects to compare against. Statistical analysis would further help refine this approach. Another assumption is that the scoring model would have to remain fairly consistent over time with few changes. Otherwise, historical scores could not be used to determine the correct range unless special adjustments are made to the scores.

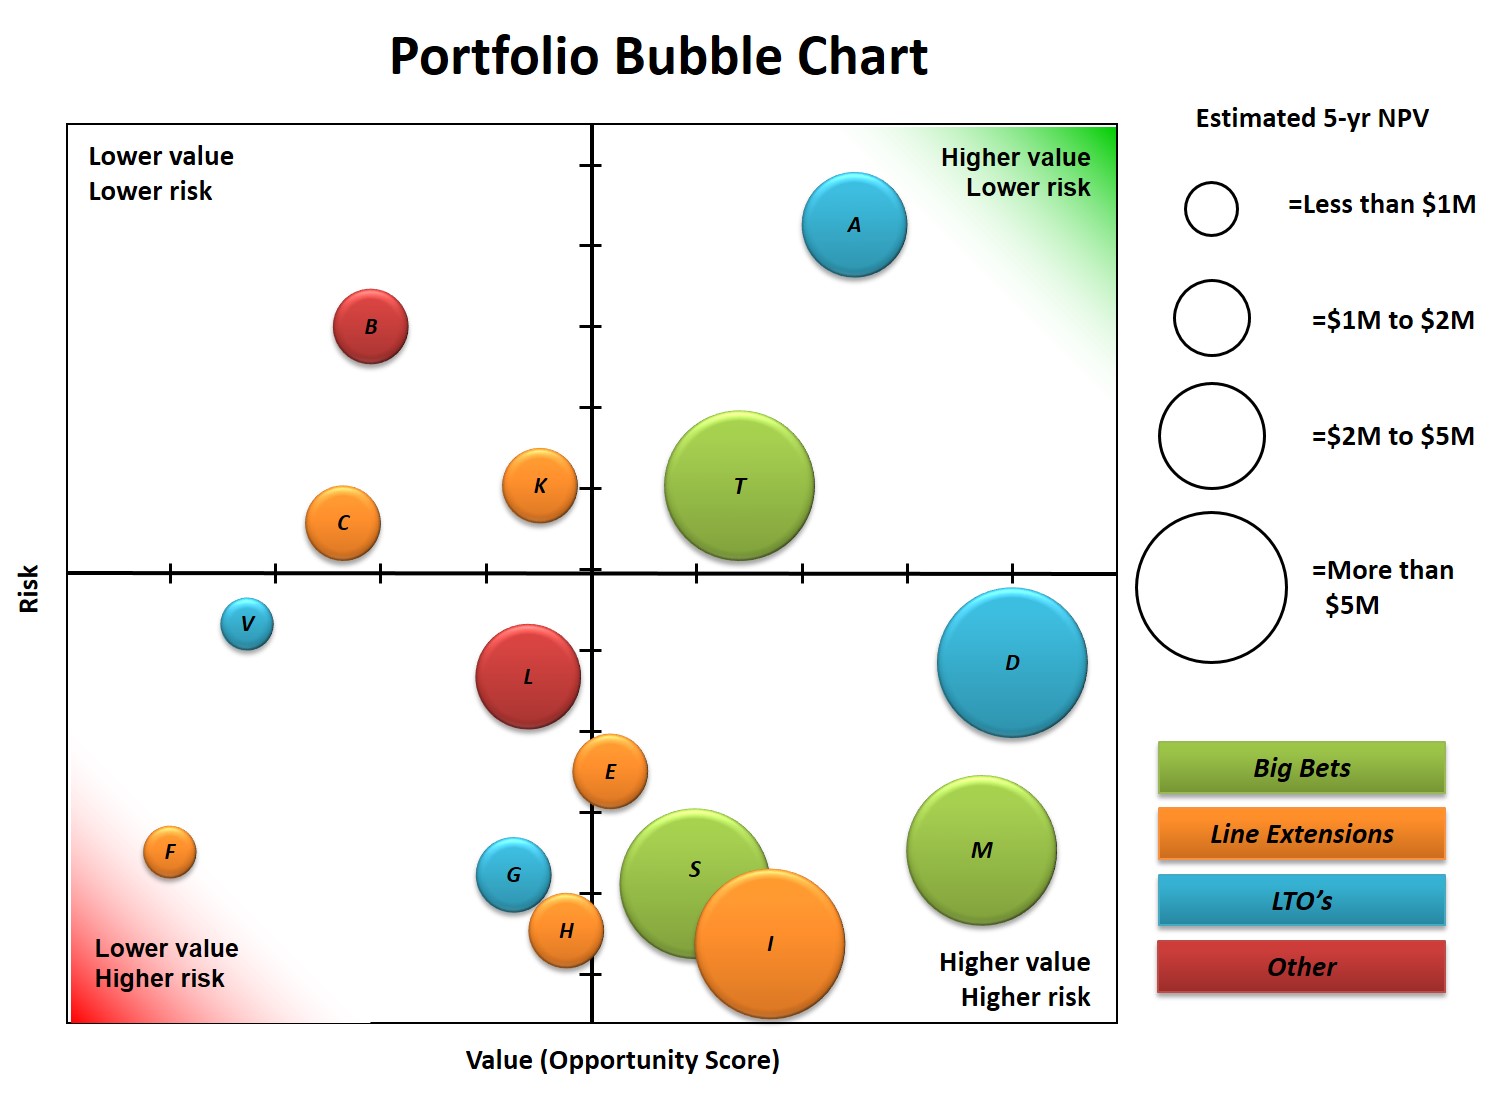
5) Finally, scoring models provide the input to build risk-value bubble charts, which provide great visual information to senior leaders. The scoring model needs to contain both value elements and risk elements as inputs for the diagram. Normally, these scores are summed to become a single number, but with the risk-value bubble chart, we need to break out the total value score and the total risk score in order to correctly plot the data on a chart. With further data elements such as strategic alignment and expected cost (or return), more information can be displayed on the bubble charts (see example below).

- Prioritize Projects With A Scoring Model - October 11, 2018
- A Guide to Building a Project Prioritization Scoring Model - September 4, 2018
- Know The Difference Between Work Intake Versus Stage-Gate - April 1, 2018
One thought to “Five Uses of a Prioritization Scoring Model”