Portfolio Optimization—Data and Constraints

In our hyper-accelerated business world, data analysis and data visualization are exceptionally important. In the realm of project portfolio management (PPM) and PMO’s, organizations need robust data analysis to strengthen decision making and improve strategic execution. The key is to have the right processes in place to collect the right data and ensure that the data is of good quality. As I have said before, data collection is not free; any data that is collected but not actively used is a waste of organizational resources. Knowing what information is needed to drive better decision making will help ensure that only important data is collected. Therefore, organizations should wisely consider what metrics, analytics, and reports are most important to senior leaders and then develop or improve the processes that drive the collection of that data. The power of having good portfolio data is to conduct strong portfolio optimization.

3 LEVELS OF ANALYSIS

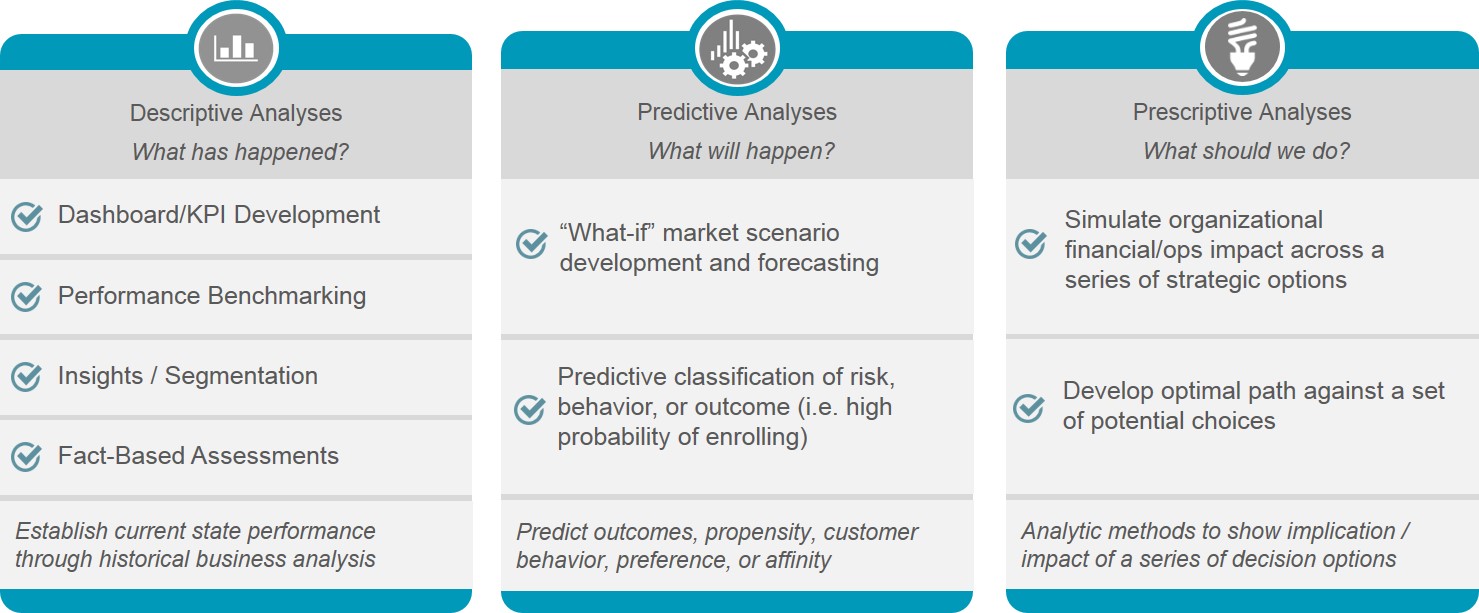
Once organizations have a stable foundation for PMO/PPM data collection, they can embark on the data analysis journey. The graphic below highlights three levels of data analysis:

  • Descriptive analysis—this helps answer the basic “what has happened?” This level of analysis is the most basic as it is fact-based and is required for developing key performance indicators and dashboards.
  • Predictive analysis—this helps answer a more important question, “what will happen?” With sufficient data, organizations can begin to predict outcomes, especially related to project risk and project performance and the impact to project delivery as well as the portfolio as a whole.
  • Prescriptive analysis—this helps answer a more difficult question “what should we do?” This requires more detailed and advanced analysis to determine the optimal path against a set of potential choices. Prescriptive analysis of the portfolio provides significant benefits by enabling organizations to choose the highest value portfolio and choose a group of projects with a higher likelihood of success.

pmo-analytic-capabilities

PORTFOLIO OPTIMIZATION

Portfolio optimization is major part of the prescriptive analysis described above. Organizations should endeavor to get to this point because it delivers substantial value and significantly improve strategic execution. In order to optimize any part of the portfolio, organizations must understand the constraints that exist (e.g. budgetary, resource availability, etc.). These constraints are the limiting factors that enable optimal scenarios to be produced. There are four basic types of portfolio optimization described below:

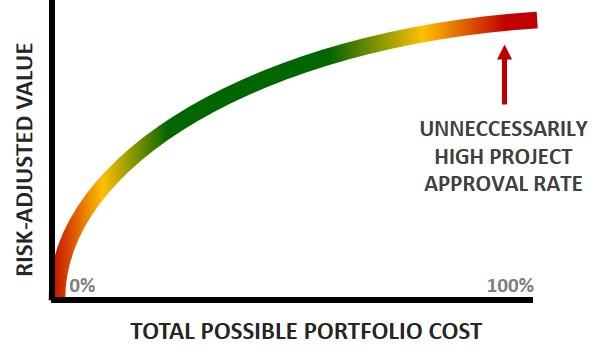
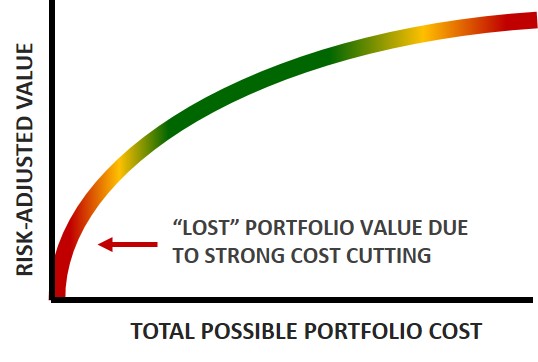
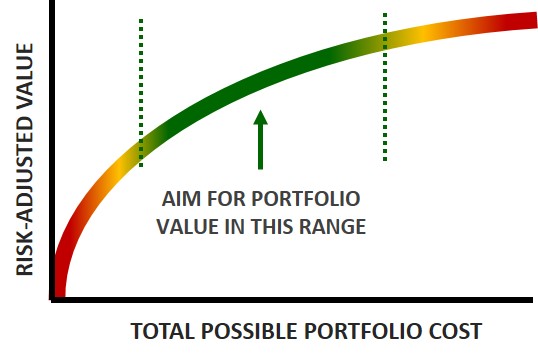
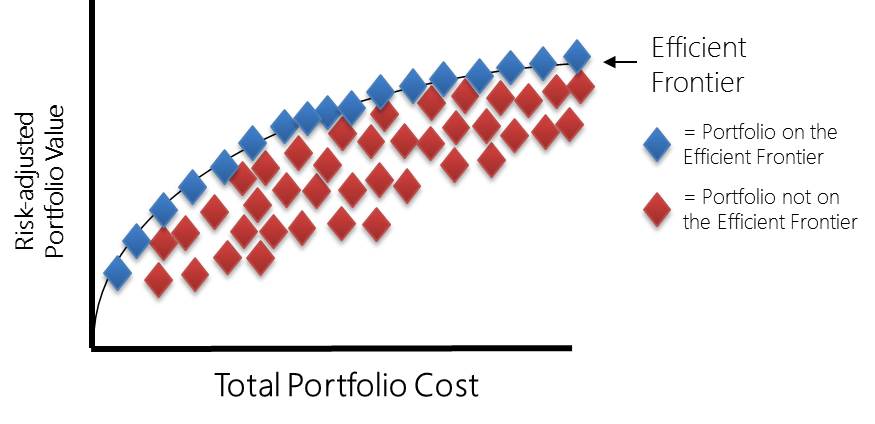
  1. Cost-Value Optimization: this is the most popular type of portfolio optimization and utilizes efficient frontier analysis. The basic constraint of cost-value optimization is the portfolio budget.
  2. Resource Optimization: this is another popular way of optimizing the portfolio, and utilizes capacity management analysis. The basic constraint of resource optimization is human resource availability.
  3. Schedule Optimization: this type of optimization is associated with project sequencing, which relates to project interdependencies. The basic constraints of schedule optimization are project timing and project dependencies.
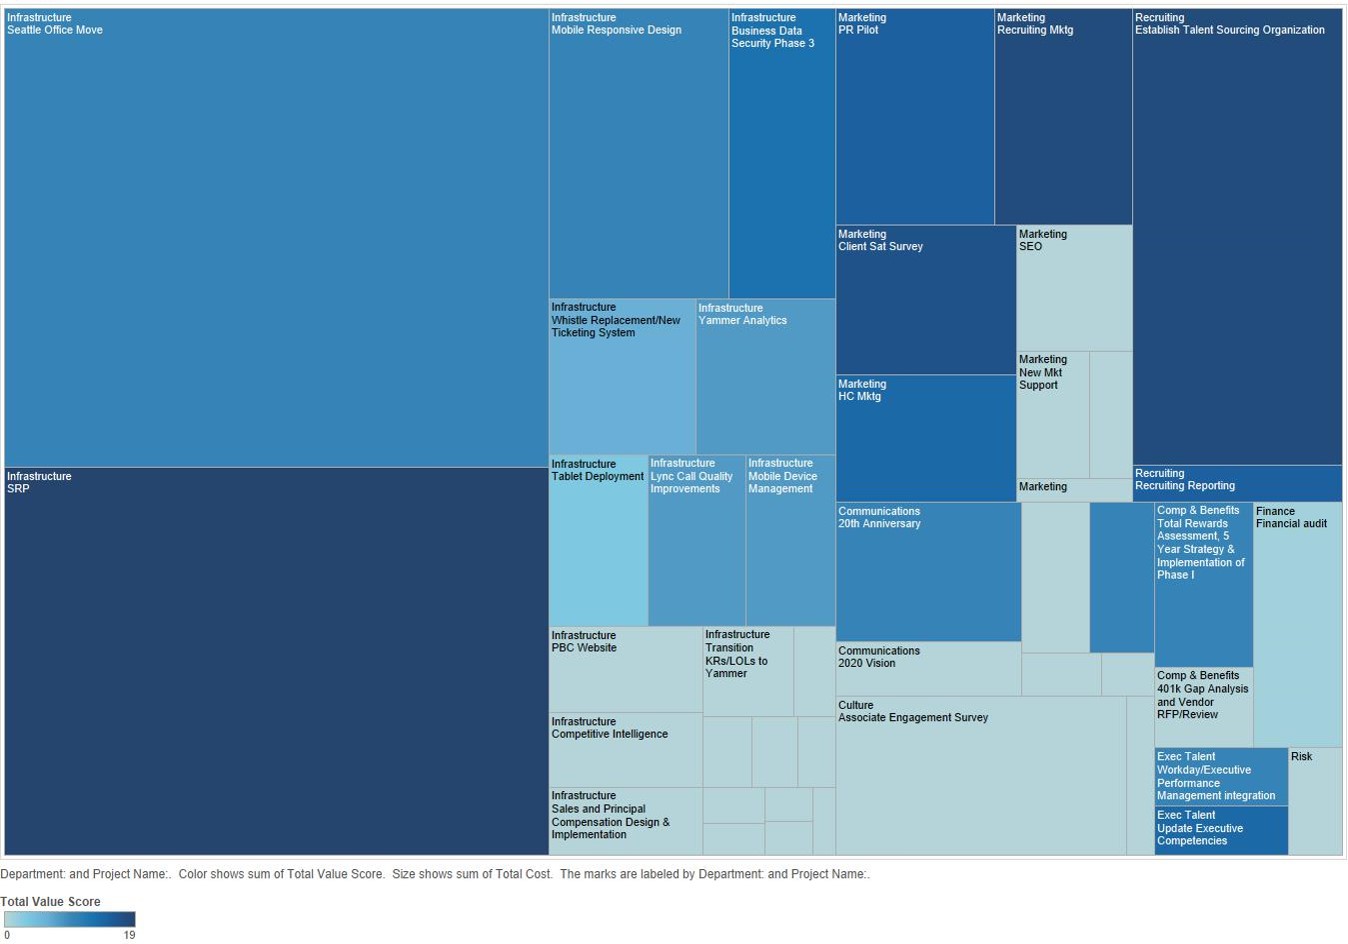
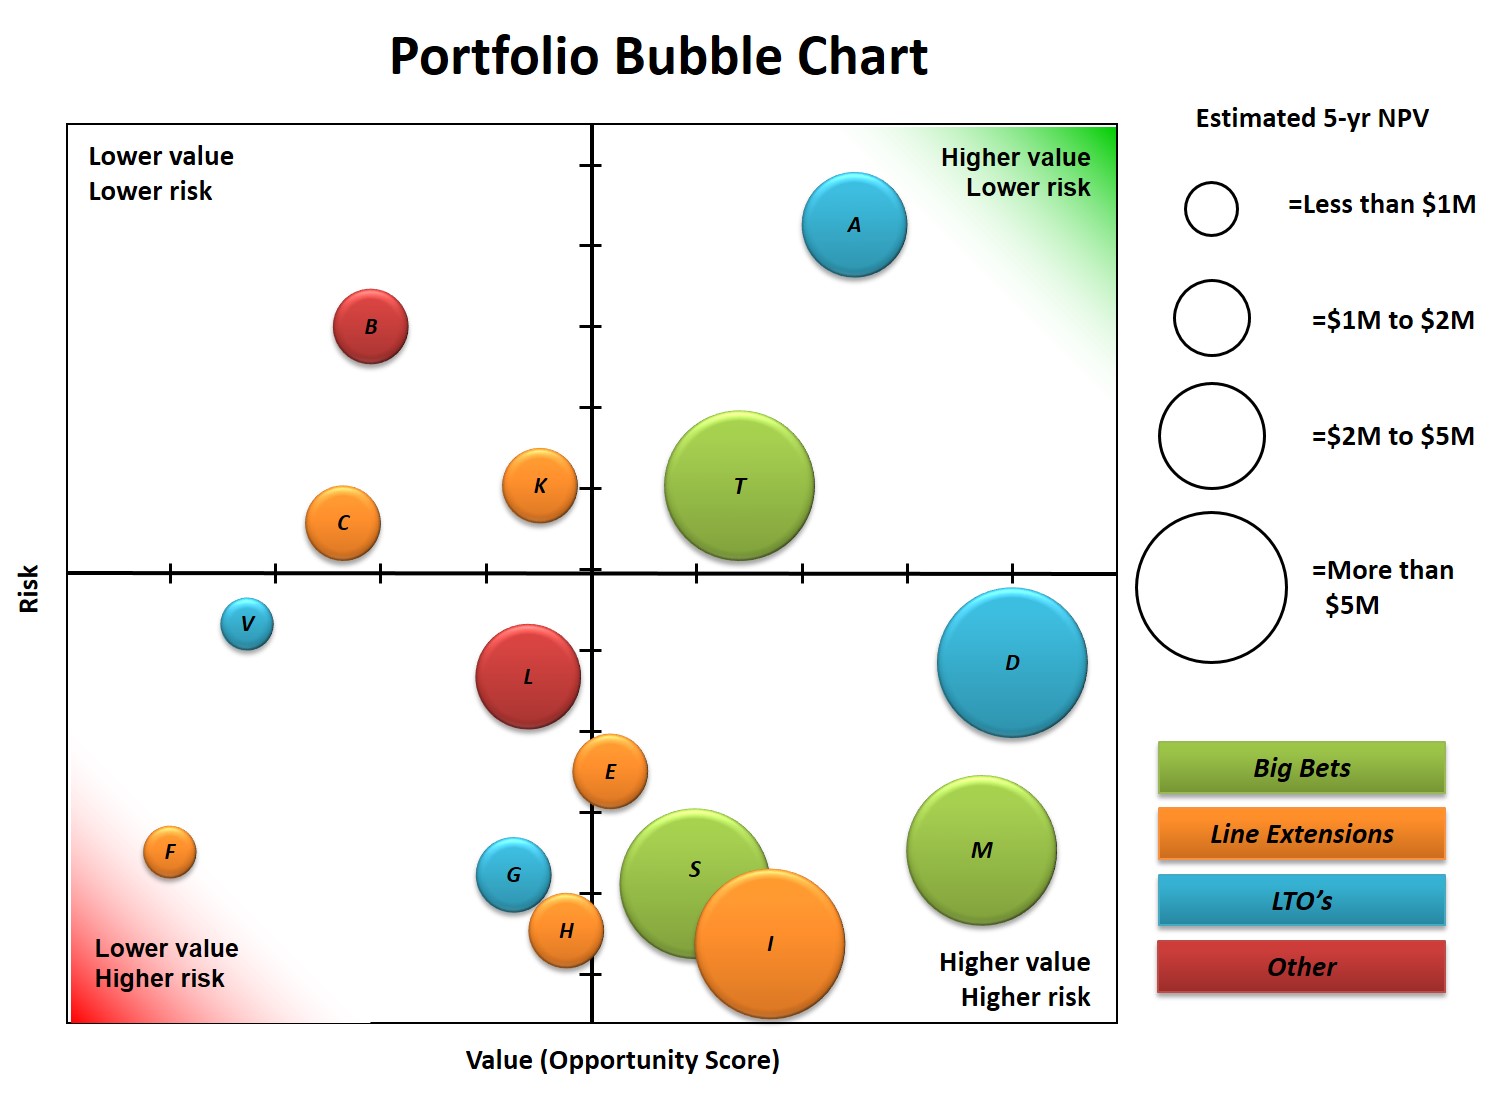
  4. Work Type Optimization: this is a lesser known way of optimizing the portfolio, but corresponds to a more common term, portfolio balancing. The basic constraints of work-type optimization are categorical designations.

APPROACH

The following diagram summarizes the above points and highlights how having the right data inputs combined with constraints and other strategic criteria can produce optimial outputs across four dimensions of portfolio optimization.

PMO Analytic Framework for Portfolio Optimization

Point B Consulting’s 5-step methodology for conducting PMO analytics enables organizations to realize the full potential of their analytic processes.

  • Define: Determine the performance criteria for measuring PMO/PPM success and develop a set of questions / hypotheses for further modeling and investigation
  • Transform: Gather and transform all available resource, project, business data for further visualization and analysis
  • Visualize: Inventory all projects with related resources and highlight key trends/insights based on project and business data
  • Evaluate: Develop analytic framework to test, adjust, and optimize against tradeoffs between project sequencing, resource allocation, and portfolio value
  • Recommend: Develop a final set of project prioritization recommendations for desired future state

In summary, portfolio optimization delivers significant strategic benefits to any organization, but getting the right processes in place to collect good data is not easy. Having the right data can enable your organization to know what is happening to the portfolio (descriptive analysis), what could happen (predictive analysis), and what senior leaders should do (prescriptive analysis).

Improve Portfolio Health By Avoiding Two Portfolio Management Extremes

Two Simple Questions

You can measure your general portfolio health with two simple questions:

1) Do you approve all or almost all of your projects?

2) Are you approving so few projects that people would say you are “cutting to the bone”?

These are two portfolio management extremes that we will examine in this post.

Approving Everything is Bad

Question number one highlights a common trap for many companies, approving all or almost all projects that get reviewed.  This indicates that the project selection process is not working well. When governance councils have a project approval over 90%, it means very few projects are getting screened out and some poor projects are probably getting approved. Approving nearly all projects also means that significant diminishing returns kick in for this group of projects and executing this work likely requires unnecessary multi-tasking and exceeding the resource capacity of critical resources. While it is theoretically possible for an organization to do an outstanding job of selecting the best possible project candidates upfront and still have a high approval rate, I doubt this occurs very often. More likely, organizations operate in a reactive mode and approve projects as they get proposed; since most projects look good by themselves and almost always have a good reason for getting initiated, the project gets approved and funded. Therefore, one of the best portfolio governance council metrics to measure portfolio health is the project approval rate. We can illustrate these concepts with the graphic below.

Portfolio Cumulative Frontier - Extreme 1
Portfolio Cumulative Frontier – Extreme 1

Here we have a bounded curve of possible portfolios (in this case we can apply the cumulative frontier, which is the cumulative portfolio value based on the rank order of projects in the portfolio, not to be confused with the efficient frontier which is based on portfolio optimization). At the upper far right is the problem area in question. If organizations are approving most projects it means there is little to no discrimination among projects which is a symptom of not having enough project candidates to review and stems from poor ideation, work intake, and weak phase-gate processes.. When organizations have more project candidates than they can reasonably take on, the governance council is pushed to do a better job of selecting projects. Organizations can still do a poor job of selecting projects (or may simply ignore resource capacity and continue approving everything) even when they have more than they can take on, but the emphasis here is on increasing the project pipeline so that the governance council will become less reactive and more proactive and say no to projects that really should be screened out. Creating a strategic roadmap to identify important projects (top-down approach) combined with an employee ideation (process bottom-up approach) will help build up the pipeline of projects and increase the decision making rigor by the governance council.

Don’t Cut to the Bone

We can also evaluate portfolio health by looking at the other extreme where an organization is cutting costs so much that any further cuts will hurt the organization’s day to day operations (aka “cut to the bone”). In one place I worked, the cost-cutting measures had been in place for years and a number of good project candidates were hardly under consideration because funds simply were not available and a buildup of project requests was accumulating. A few high value projects got approved, but “money” was left on the table as a result of not taking action on those good project candidates. In some cases, the rigor to do a good cost-benefit analysis is absent and makes it difficult to communicate how much ‘value’ is being ignored by not taking on additional projects due to strong cost cutting measures. Such extreme cost cutting also has the negative residual effect of discouraging innovation among employees. We can also illustrate this with the same graphic.

Portfolio Cumulative Frontier - Extreme 2
Portfolio Cumulative Frontier – Extreme 2

Summary

In short, asking simple questions about the approval rate of projects and the cost-cutting measures of an organization can highlight general portfolio health. In both cases, organizations should be pushing toward the middle. Adding more project candidates will help ensure that only the most valuable projects get approved. In the case of extreme cost-cutting, companies should improve their ability to measure project value in order to communicate the ‘value’ left on the table. This is best accomplished when a company is doing reasonably well and not when the company is truly in dire straits. Cutting costs “to the bone” is never a good way to stimulate innovation, therefore careful attention is needed when companies are cutting costs too much and not investing in the future.

Cumulative Frontier - Healthy Portfolio

Portfolio Reports – Part 2

In the previous post, we reviewed very basic portfolio reports that can easily generated with initial data. In this post we will continue examining portfolio reports with an emphasis on intermediate level reporting.

Pareto Chart (Financial Contribution)

All companies should have a breakdown of project cost, but not all companies capture project value. For those that do, a Pareto chart ordered by financial contribution (e.g. NPV) provides aggregate portfolio visibility of the most valuable projects. We also find that the 80/20 rule often applies (20% of the projects deliver 80% of the portfolio’s value). This type of Pareto chart provides great visibility of the entire portfolio and highlights how a subset of projects support overall financial contribution.   It is a great report for focused discussions regarding how to manage the long tail of low value projects. It is critically important for the portfolio governance team to recognize this tail of projects and how to deal with it. The minimum required data to generate this report is a financial metric (cost, dollar savings, NPV, etc.) and the Project Name or ID.

Advanced Pareto Chart

We can take this Pareto chart a step further and overlay additional data points to make it an even more powerful report. In the example below, we have overlaid the cumulative R&D labor (as a percentage of R&D labor across all projects). By adding in this additional resource data, we can clearly see that we can still achieve 80% of the total portfolio value with only 65% of the anticipated R&D spend. In the absence of portfolio optimization, this insight can be valuable when managing bottleneck resources as it points to additional projects that can be accomplished without the use of critical resources. You can substitute R&D for any other role in your company that is a bottleneck to many projects.

These enhanced portfolio reports provide great visibility of the entire portfolio and how a subset of projects support overall financial contribution.   It is an even better tool for focused discussions regarding how to manage “the tail”. All you need is the following data: Financial metric (cost, dollar savings, NPV, etc.), project name/ID, Resource data or other categorical measurement.

Advanced Portfolio Pareto Chart

Treemaps

Treemaps offer a graphical alternative to traditional risk-value bubble charts and provides a quick glance of the entire portfolio with categorical information included (e.g. box size = cost, color = project value, grouping by category). The basic information may be similar to traditional bubble charts, but the coloring and sizing can raise awareness of different problems or challenges in the portfolio and is a great report for identifying misaligned projects. I recommend using treemaps in addition to bubble charts (which we will discuss in the next post).  Treemaps are common in data visualization software such as Tableau and requires data such as: financial measure (cost, revenue, savings), risk measures (optional), project value (e.g. a value score). Instead of coloring based on value score, you could color based on alignment to particular strategic objectives or by business unit. The example below shows a basic cost/value treemap.

Portfolio Treemap Example

Summary

In this post, we have seen two great intermediate portfolio reports that will enhance governance discussions. These reports help move senior leaders away from a singular project view to an aggregate project view. Even though we adjust individual portfolio components (aka projects), our view is to identify an optimal portfolio.

Are you using advanced Pareto charts and treemaps in your portfolio meetings? Share a comment below.


Portfolio Review Meetings

Portfolio Review Meetings

Portfolio review meetings are a great way to review and assess the entire project portfolio with the governance team. Unfortunately in practice, these meetings can be overwhelming, time consuming, and unproductive. There are many ways to conduct a portfolio review meeting, but one of the key questions of the governance team is “what do they want to accomplish at the end of the portfolio review”? For some organizations, portfolio review meetings are about getting project status of every project in the portfolio. For other organizations, portfolio review meetings are designed to evaluate each project in the portfolio with the intention of updating priorities.

Options for Portfolio Review Meetings

With this background in mind, we can look at four options for conducting portfolio review meetings:

  • OPTION 1: A review of all in-flight projects, current status, relative priority, business value, etc. Some projects may be cancelled, but the primary purpose is to inform the LT of the current in-flight projects.
  • OPTION 2: A partial review of projects in the portfolio consisting of high-value/high-risk projects. This provides more in-depth information of critical initiatives and may result in a possible change of priority of certain projects.
  • OPTION 3: A high-level review of all projects in the portfolio with the intention of updating project priorities for every project in the portfolio.
  • OPTION 4: A review of portfolio scenarios that meet current business needs followed by a selection of a recommended portfolio

Option 4 comes courtesy of Jac Gourden of FLIGHTMAP in a 2012 blog post and is the best approach I have seen for conducting portfolio review meetings. I also have sat through long sessions (although not all-day sessions) of reviewing all the projects in the portfolio and it can be painstakingly tiring. Moreover, these types of portfolio review meetings wear out governance team members and do not yield much value.  While there is certainly a time and a place for review the status of all projects or conducting a lengthy review for the purpose of re-prioritizing projects in the portfolio, taking a strategic view is the way to go. Rather than merely focusing on individual projects, a portfolio team can compile a few portfolio scenarios that should be reviewed by the governance team. In many instances, there is significant overlap between the portfolio scenarios, but the emphasis is on the business goals of the portfolio and how a portfolio scenario supports a certain goal. Some examples of portfolio scenarios include:

  • Revenue Growth Scenario
  • Customer Growth Scenario
  • Market Growth Scenario
  • Reduced R&D Spend Scenario
  • Balanced Portfolio Scenario

These scenarios are easier to produce when efficient frontier analysis is applied. Even after a portfolio recommendation is accepted, there is further work to screen out the projects not included in the portfolio, and in some cases to make worthy exceptions for some projects that would have otherwise been removed from the portfolio.

What do you think? Have you tried this approach before? How successful was it? Let me know.

Five Uses of a Prioritization Scoring Model

Project prioritization is one of the most common topics in portfolio management literature. Within the context of project prioritization is the matter of scoring models because scoring models are the most widely used approach to prioritize projects. Although there are a lot of opinions on the effectiveness of common scoring models, they are nonetheless the most common method for prioritizing projects. However, most people may not realize the many uses of a scoring model and how it drives better decision making beyond project prioritization. In this post, we will look at five uses of a scoring model.

1) Project prioritization is the most common reason for using scoring models. As we saw in a previous post, project prioritization is for resource allocation. Since portfolio management is about delivering the most business value through projects, it is logical to ensure that resources are spent on the most important work. Ranking projects helps provide a common understanding of what is most important in the organization and scoring models are one of the easiest ways of establishing a rank order. For more information on using prioritization scoring models to rank order projects, please see Mastering Project Portfolio Management.

2) A prioritization scoring model is also used for project selection. The idea is to rank projects from highest value to lowest value and select projects until resources run out. This approach has merits over other approaches that do not sufficiently take account of strategic drivers. However, it can be shown that even simple optimization techniques can yield a higher value portfolio at the same cost. For organizations that do not employ portfolio optimization techniques, using a scoring model to rank order projects and fund projects until resources runs out is a reasonable way to go.

3) Portfolio optimization is very useful for identifying higher-value portfolios than merely using scoring models as discussed in the previous paragraph. The scores for each project can represent a “utility score” which can then be used as the input for the optimization calculations. In this way, projects are optimized based on all the scoring inputs, not merely on net present value or some other financial estimate. For more information about this technique, please refer to Richard Bayney’s book Enterprise Project Portfolio Management: Building Competencies for R&D and IT Investment Success.

Efficient Frontier Example

4) A prioritization scoring model can also be used to make go/no-go decisions at gate review meetings. There are at least two ways to accomplish this:

A) Organizations can predetermine a threshold score that projects must exceed in order to be considered for inclusion in the portfolio (known as a scoring hurdle).

B) An alternative approach is to use a scoring range to provide better input to the decision makers. In other words, if the scoring range were from 0 to 100, scores below 30 might represent high-risk/low-value investments that should otherwise be rejected, but may only get approved if there were other intangible factors not considered by the scoring model. Projects in the middle range of scores might be approved with more scrutiny, and projects in the upper range would likely get approved. The prerequisite to taking this approach is to have an adequate number of historical scores from past projects to compare against. Statistical analysis would further help refine this approach. Another assumption is that the scoring model would have to remain fairly consistent over time with few changes. Otherwise, historical scores could not be used to determine the correct range unless special adjustments are made to the scores.

5) Finally, scoring models provide the input to build risk-value bubble charts, which provide great visual information to senior leaders. The scoring model needs to contain both value elements and risk elements as inputs for the diagram. Normally, these scores are summed to become a single number, but with the risk-value bubble chart, we need to break out the total value score and the total risk score in order to correctly plot the data on a chart. With further data elements such as strategic alignment and expected cost (or return), more information can be displayed on the bubble charts (see example below).

Portfolio Bubble Chart

What Are We Optimizing? Part 1

Portfolio optimization entails all the steps necessary to construct an optimal portfolio given current limitations and constraints. These steps occur repeatedly in the portfolio management lifecycle and work in tandem with Stage-Gate processes for selecting the right projects. The purpose of optimization is to maximize the portfolio value under certain constraints. Understanding and managing these constraints is critical for making portfolio optimization a useful component of the portfolio management process.

We can optimize a portfolio in multiple ways:
1) Cost-value optimization (aka ‘efficient frontier analysis’)
2) Resource optimization (aka ‘capacity management’)
3) Schedule optimization (project sequencing)
4) Work type optimization (portfolio balancing)

The question then is, when we are optimizing the portfolio, what is it that we are optimizing? Many portfolio management computing systems promote efficient frontier analysis which commonly focuses on cost-value optimization. However, as useful as this is, it does not often take into account resource optimization, schedule optimization, or even work-type optimization.  It is possible for portfolio systems to include some of these constraints, but most are not advertised in that way.

Furthermore, it is fundamental to understand the limitations and constraints on the portfolio, for without knowing the constraints it is not possible to optimize the portfolio and maximize organizational value.  The constraint for cost-value optimization is the available budget. This helps us determine an optimal budget based on limited financial resources. The constraint for resource optimization is human resource availability. This can be measured in a number of ways and will be discussed in another post. Optimizing against critical resource availability is recommended. Schedule optimization is focused on project timing and dependencies. Work type optimization is focused on categorical designations (i.e. portfolio balancing—how much do we want to invest in key areas).

The Efficient Frontier Will Get You to the Green

According to Merkhofer, “the efficient frontier is the bounding curve obtained when portfolios of possible investments are plotted based on risk and expected return. The efficient frontier shows the investment combinations that produce the highest return for the lowest possible risk. The goal for selecting projects is to pick project portfolios that create the greatest possible risk-adjusted value without exceeding the applicable constraint on available resources.”

In both the PPM literature and portfolio tool brochures, one would be led to believe that the application of the efficient frontier will provide the final answer of which projects to select. While doing more research on efficient frontier techniques, I started considering the work that still needs to be done once an ‘optimal’ solution has been developed that maximizes value under current constraints. Unless skill sets are included in the optimization, more time will be needed to determine if resources are available to execute the “optimal” portfolio. Additionally, the efficient frontier does not help with project sequencing, therefore further analysis will be required to properly sequence the ‘optimal’ portfolio. This is not to say that the efficient frontier technique should not be used, only that it still takes a little more time to complete the optimization exercise once the ‘optimal’ list of projects have been selected.

In fact, the efficient frontier approach can actually save management a lot of time and discussion by pointing to a set of projects that delivers maximum value for a particular level of spending. Instead of fighting for what should be included, the discussion can be focused on those projects that bring the portfolio off of the efficient frontier (such as mandatory projects that don’t provide much value). To use a golf analogy, using the efficient frontier will not give you a ‘hole in one’, but it will get you to the putting green nearly every time in one stroke. Every golfer would like that.