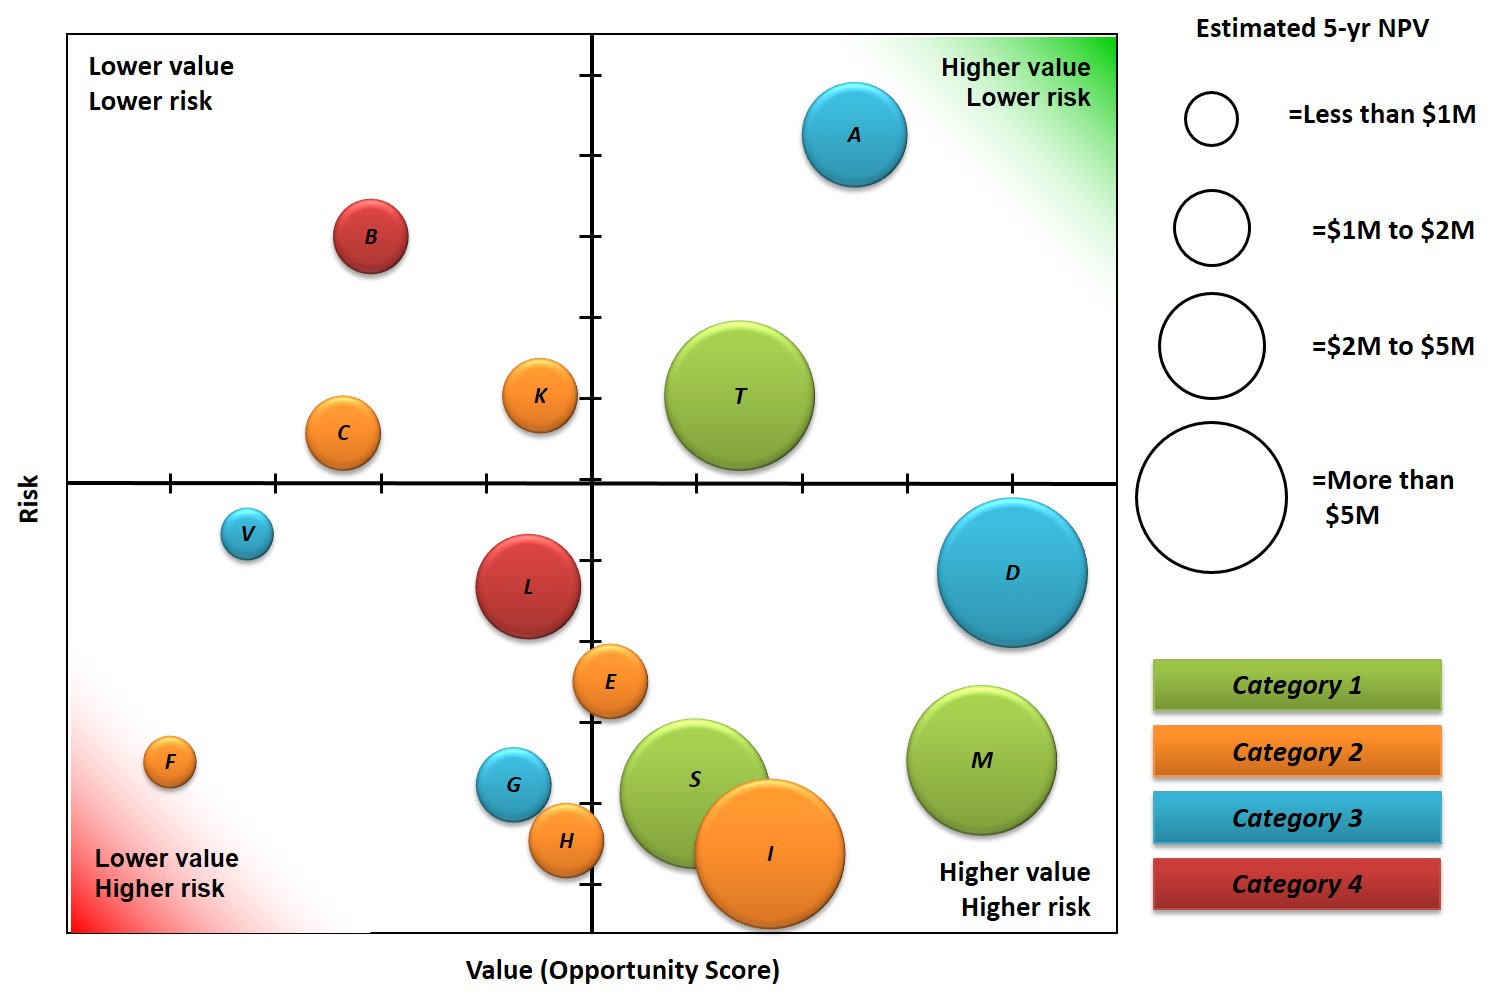
Portfolio Bubble CHart Example
The risk-value bubble chart represents a portfolio view of all projects and places projects in quadrants based on value and risk. Scoring models provide the input to build risk-value bubble charts which provide great visual information to senior leaders.

President at Acuity PPM
I am the President at Acuity PPM. We deliver easy to use project portfolio management software to replace spreadsheets. If your PMO is still using spreadsheets to track and manage the project portfolio, contact us.
Latest posts by Tim Washington (see all)
- Prioritize Projects With A Scoring Model - October 11, 2018
- A Guide to Building a Project Prioritization Scoring Model - September 4, 2018
- Know The Difference Between Work Intake Versus Stage-Gate - April 1, 2018