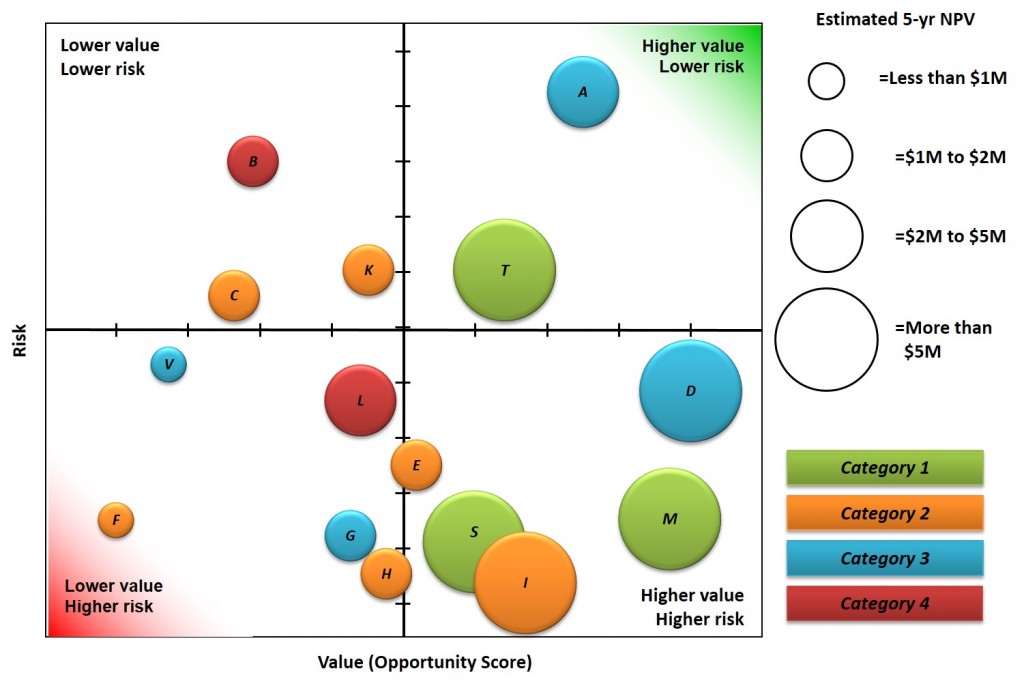
This is the third post in a series on portfolio management reports. In the first post, we reviewed introductory portfolio management reports that convey the basic dimensions of the portfolio. In the second post we reviewed treemaps and advanced pareto charts that can help identify outlier projects worthy of more scrutiny. In this post we will look at the most common report for project portfolio management, portfolio bubble charts.
SUMMARY
The risk-value portfolio bubble chart represents a portfolio view of all projects and puts projects into one of four quadrants based on value and risk; this is important for identifying projects that drive overall greater value to the organization compared to other projects as well as highlight projects that should likely be screened out.
BENEFITS OF PORTFOLIO BUBBLE CHARTS
One of the key benefits to a portfolio bubble chart is to quickly show the balance of the current portfolio. Using portfolio bubble charts with the portfolio governance team can focus conversations to help better manage the portfolio. When reviewing projects that are in the higher-value/ lower-risk quadrant, the portfolio governance team should ask the question, “how can we get more of these types of projects in the portfolio?” Likewise with the lower-value/higher-risk projects, the portfolio governance team should ask how to avoid those types of projects. These discussions will greatly enhance the management of the portfolio and enable the portfolio governance team to “manage the tail” and ensure that only the best projects are selected and executed.
DATA NEEDED
There are four primary data elements needed to build the risk-value bubble chart: value scores for each project, risk scores for each project, categorical data, and the project cost or financial benefits of the project (commonly used for bubble size). In an older post, I wrote in detail on how to build such a chart in Excel and the notion of normalizing the data. A prioritization scoring mechanism is typically required to build the best portfolio bubble charts.

- Prioritize Projects With A Scoring Model - October 11, 2018
- A Guide to Building a Project Prioritization Scoring Model - September 4, 2018
- Know The Difference Between Work Intake Versus Stage-Gate - April 1, 2018

2 thoughts to “Portfolio Reports – Portfolio Bubble Charts”