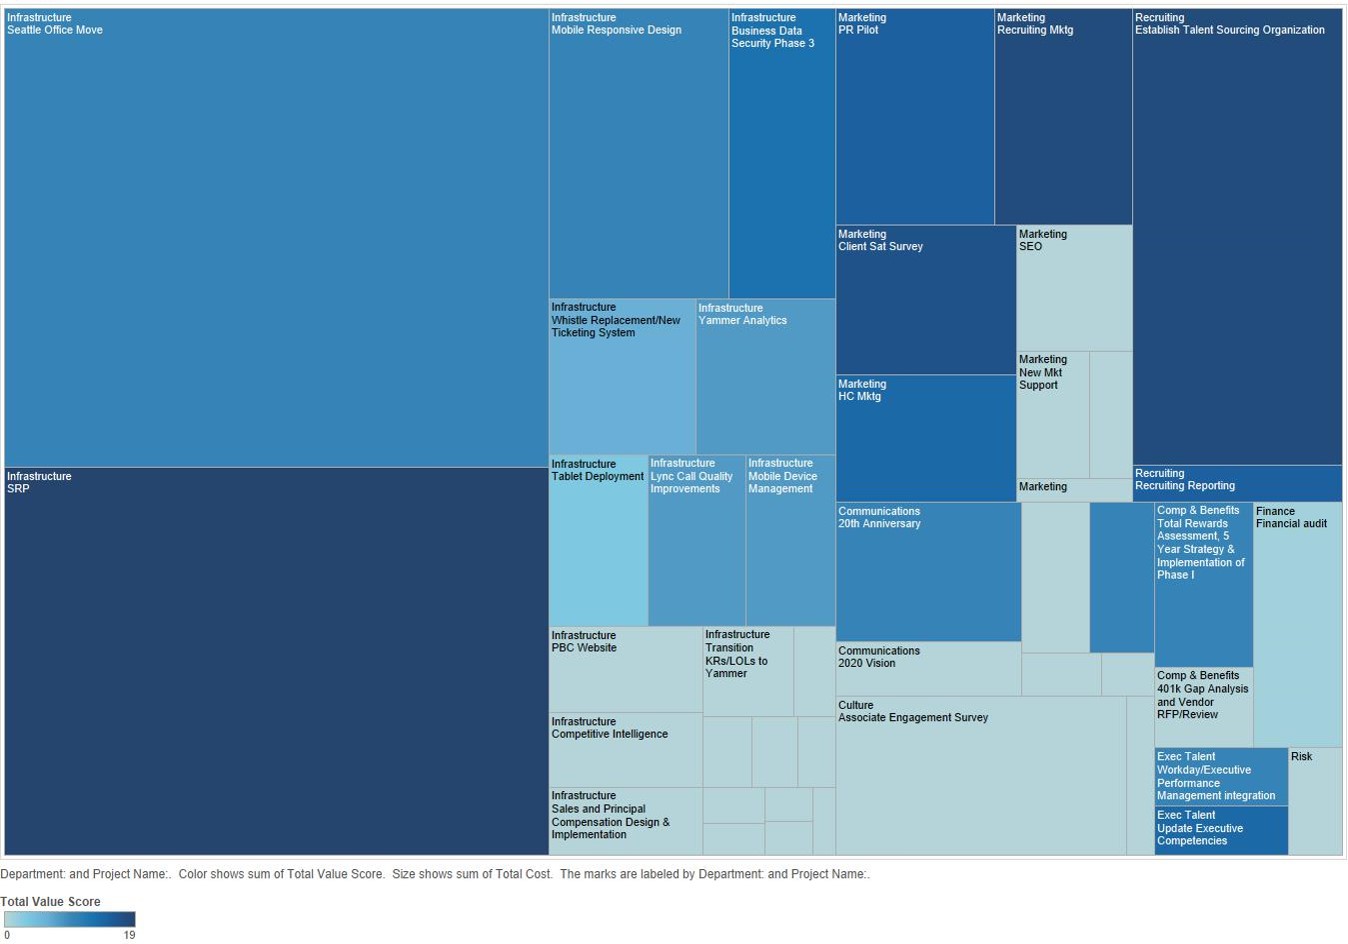
Portfolio Treemap Example
Treemaps offer a graphical alternative to traditional risk-value bubble charts and provides a quick glance of the entire portfolio with categorical information included (e.g. box size = cost, color = project value, grouping by category). The basic information may be similar to traditional bubble charts, but the coloring and sizing can raise awareness of different problems or challenges in the portfolio and is a great report for identifying misaligned projects. I recommend using treemaps in addition to bubble charts (which we will discuss in the next post). Treemaps are common in data visualization software such as Tabeleau and requires data such as: Financial measure (cost, revenue, savings), risk measures (optional), project value (e.g. a value score). Instead of coloring based on value score, you could color based on alignment to particular strategic objectives or by business unit. The example below shows a basic cost/value treemap.

- Prioritize Projects With A Scoring Model - October 11, 2018
- A Guide to Building a Project Prioritization Scoring Model - September 4, 2018
- Know The Difference Between Work Intake Versus Stage-Gate - April 1, 2018