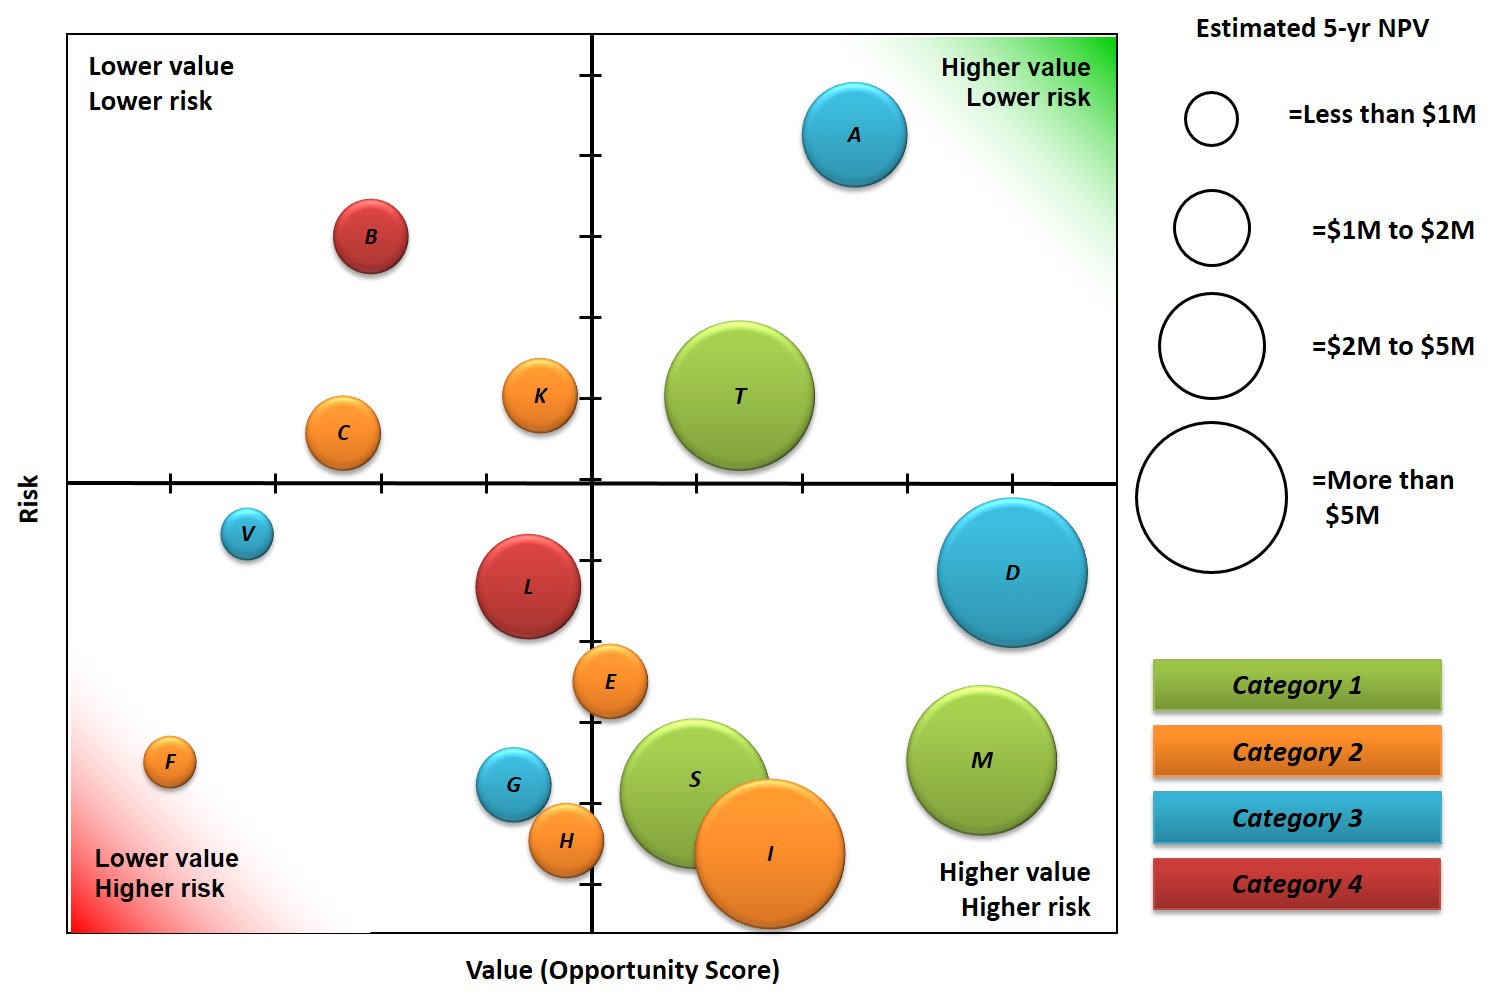
The risk-value bubble chart represents a portfolio view of all projects and places projects in quadrants based on value and risk. Scoring models provide the input to build risk-value bubble charts which provide great visual information to senior leaders.
Latest posts by Tim Washington (see all)
- Prioritize Projects With A Scoring Model - October 11, 2018
- A Guide to Building a Project Prioritization Scoring Model - September 4, 2018
- Know The Difference Between Work Intake Versus Stage-Gate - April 1, 2018
